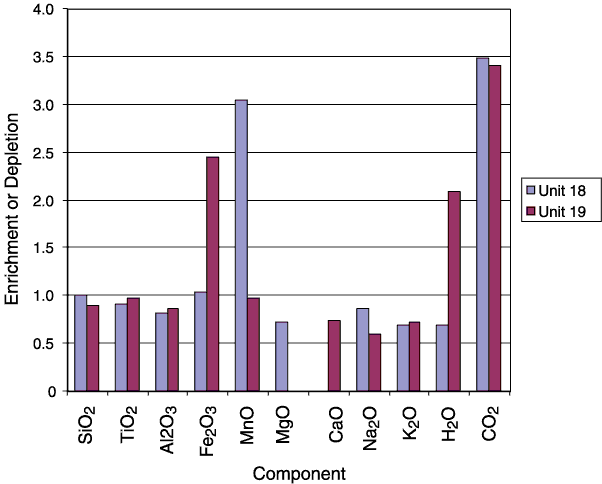
Figure
F82. Net mass gain
("enrichment") or loss ("depletion") of rock components from
the most highly altered ("bleached") intervals in Units 18 and 19. The
composition of the altered rock was divided by the composition of the
least-altered sample (assumed protolith) from that unit. Thus, values greater
than unity represent mass gains during alteration, whereas values less than
unity represent mass loss. Samples 183-1139A-70R-1 (Piece 2A, 17-20 cm) and
70R-2 (Piece 1F, 141-145 cm) were selected as highly altered and relatively
unaltered pairs, respectively, in Unit 18. Corresponding samples from Unit 19
were Samples 183-1139A-71R-7 (Piece 1B, 25-27 cm) and 71R-4 (Piece 11, 135-138
cm). The assumed protoliths have H2O and CO2
concentrations of 0.8 to 2.3 wt% and, as a consequence, are only slightly
altered. Missing histograms for CaO and MgO reflect cases where concentrations
were below detection. For complete chemical analyses for Hole 1139A basement
units, see "Igneous
Petrology" and Table T11.


![]()