Figure
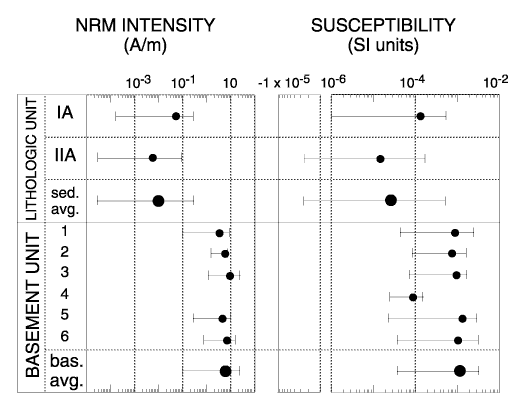
F41. Average NRM
intensity and MST susceptibility of each lithologic and basement unit. Large
solid circles give the average values for all sediments and basement rocks. The
horizontal bars show the range between maximum and minimum values in the
respective units.


![]()