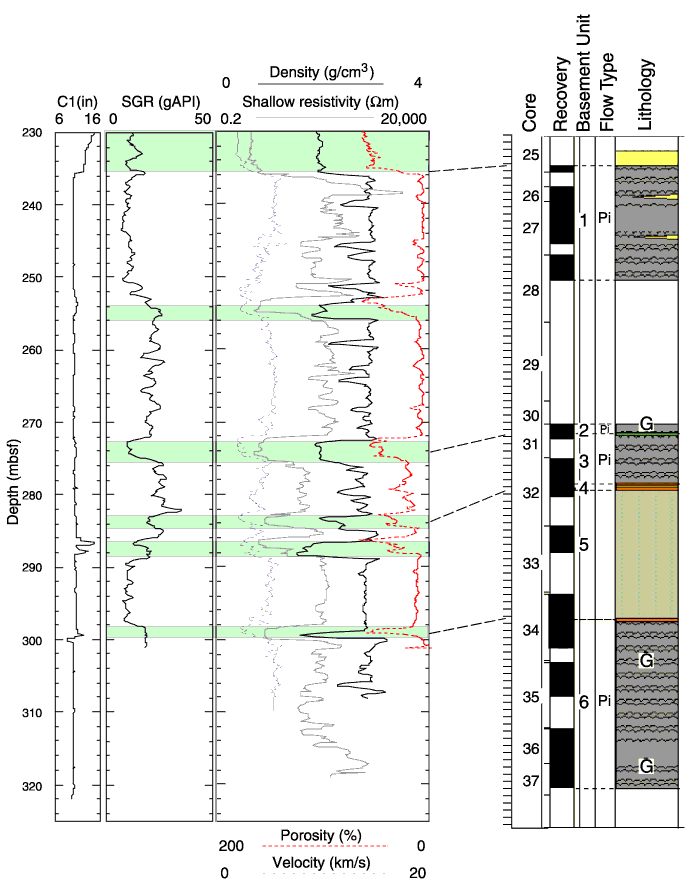
Figure
F55. Composite of
wireline logs at Site 1140 compared to the core-derived lithostratigraphy. The
integrated interpretation of FMS images and standard logs enable clear
identification of the displayed unit boundaries. The log-derived basement unit
boundaries are given in Table T15
(see "Physical Volcanology").
SGR = total gamma-ray signature. Shading = sedimentary regions with low density,
resistivity, velocity, and high porosity. Other abbreviations are defined in
Figure F15.


![]()