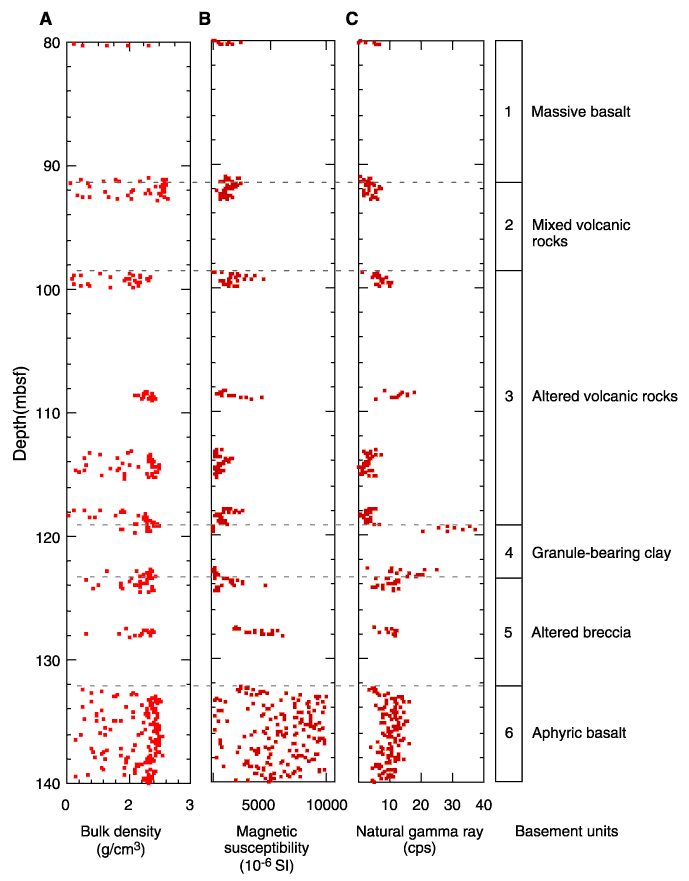
Figure
F74. Downhole
profiles of MST measurements from Hole 1142A, including (A)
GRAPE bulk density, (B) whole-core measurements of magnetic
susceptibility, and (C) natural gamma ray. Horizontal dashed
lines separate basement Units 1-6. Lithologic units are shown to the right. Note
that basalt recovered near the bottom of the washed interval (0-91.0 mbsf) has
arbitrarily been plotted at ~80 mbsf.