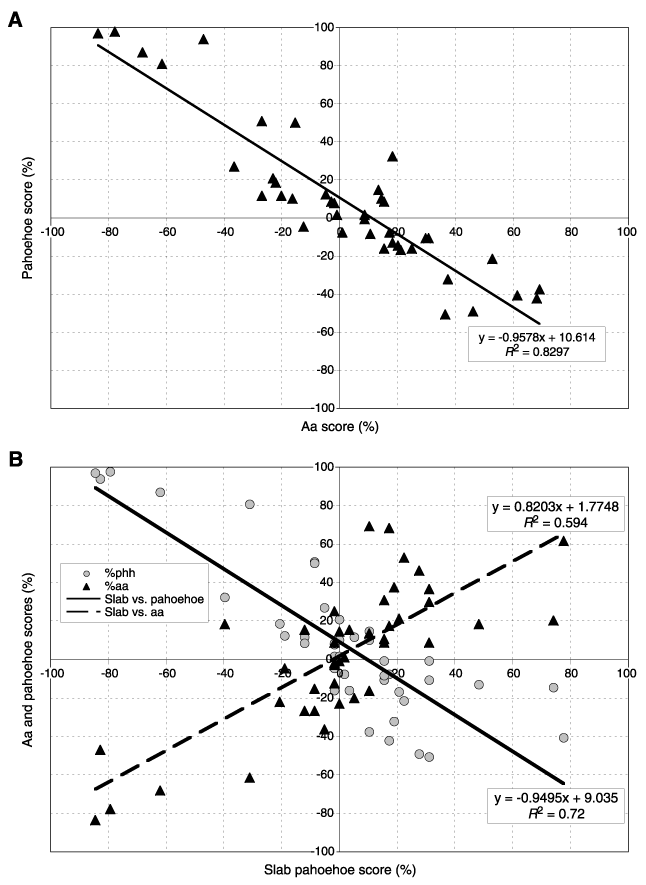
Figure F3. Results from application of the automated flow classification system to Leg 183 subaerial lava flows. A. Plot of aa vs. pahoehoe. The excellent anticorrelation demonstrates how clearly aa and pahoehoe are distinguished by this method. B. Plot of slab pahoehoe vs. aa and pahoehoe. This shows that slab pahoehoe is very similar to aa and is clearly distinguished from regular pahoehoe. (Continued on next page.)


![]()