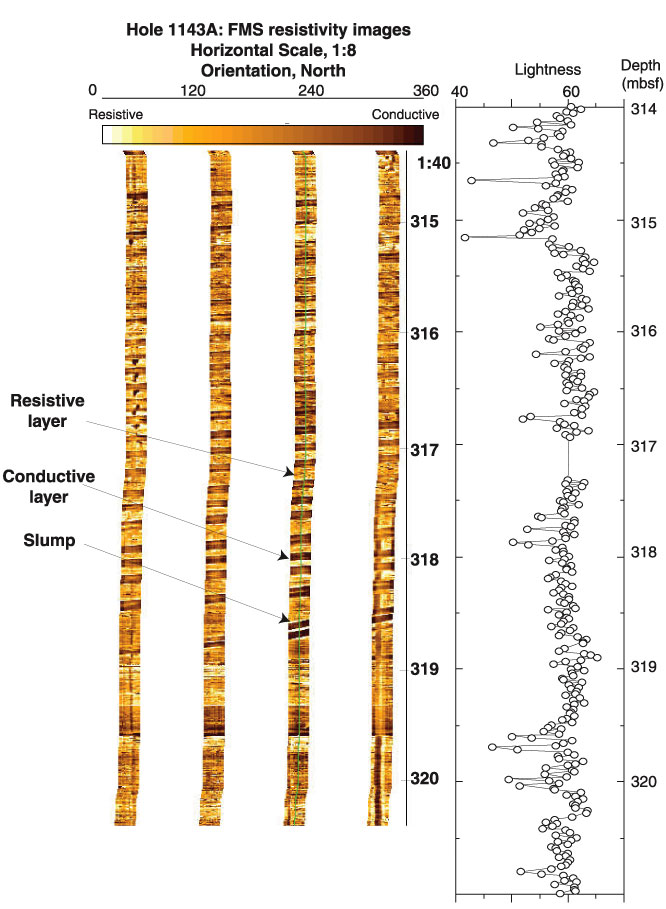
Figure F39. Formation MicroScanner (FMS) image displaying alternation of darker and lighter intervals compared to the lightness curve (see "Physical Properties"). The sediment reveals bedding structures, which can be related to the slump seen in Core 184-1143A-36X. Horizontal exaggeration is ~8×.
![]()