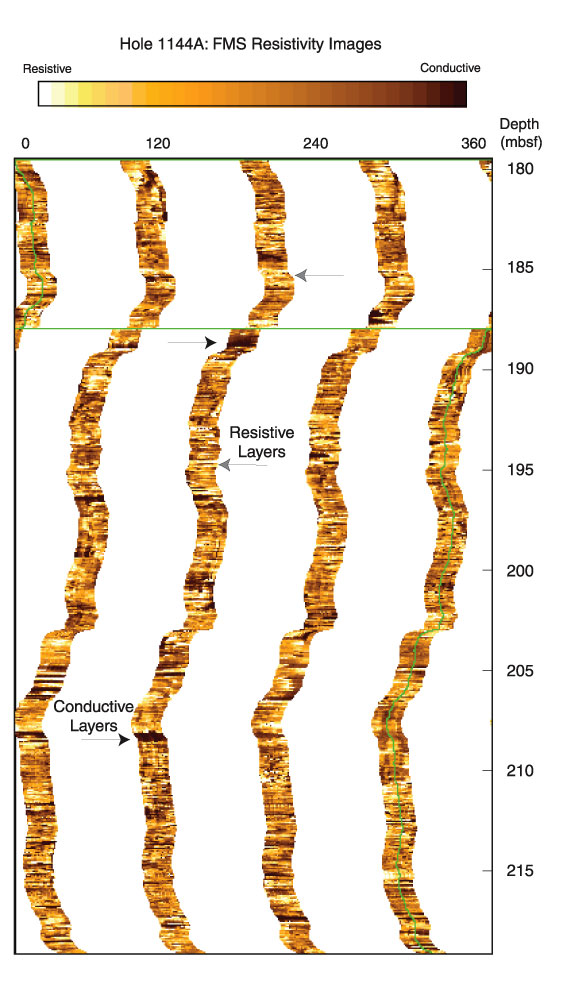
Figure F38. Formation MicroScanner (FMS) image from downhole logging data displaying alternation of relatively conductive (darker) and resistive (lighter) intervals.