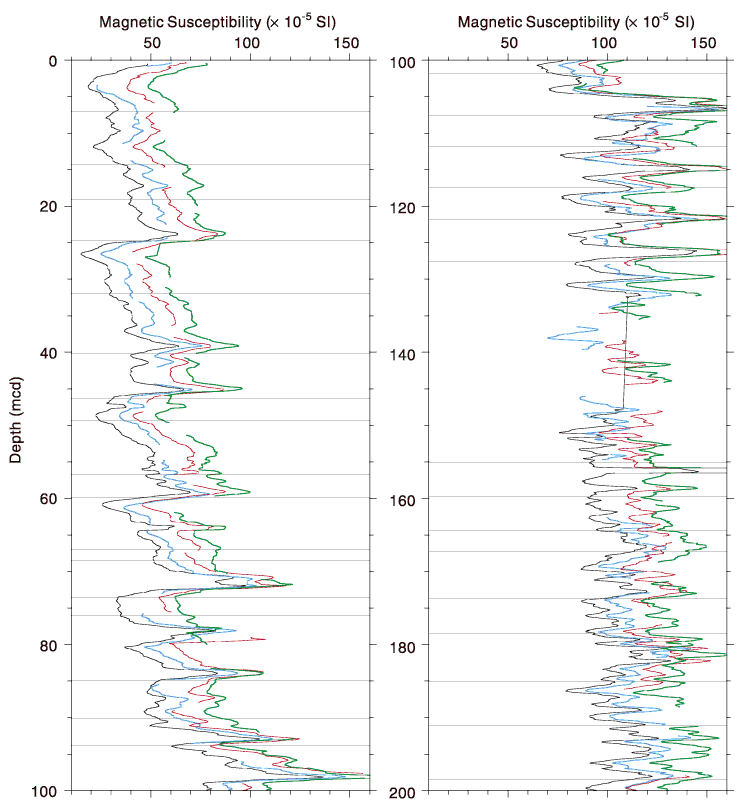
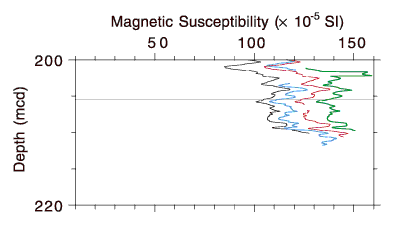
Figure F1. Smoothed (11-point running average)/correlated MS data and the splice for the three holes at Site 1145 (spliced MS data in this figure are also available in ASCII format). The order of the four arrays (the splice and Holes 1145A through 1145C) increases outward from the origin. The hole arrays are offset from each otheróand from the spliceóby a constant (10.0 ◊ 10-5 SI units) so that only the splice is plotted relative to the absolute MS value. Lines identify the splice tie points.


![]()