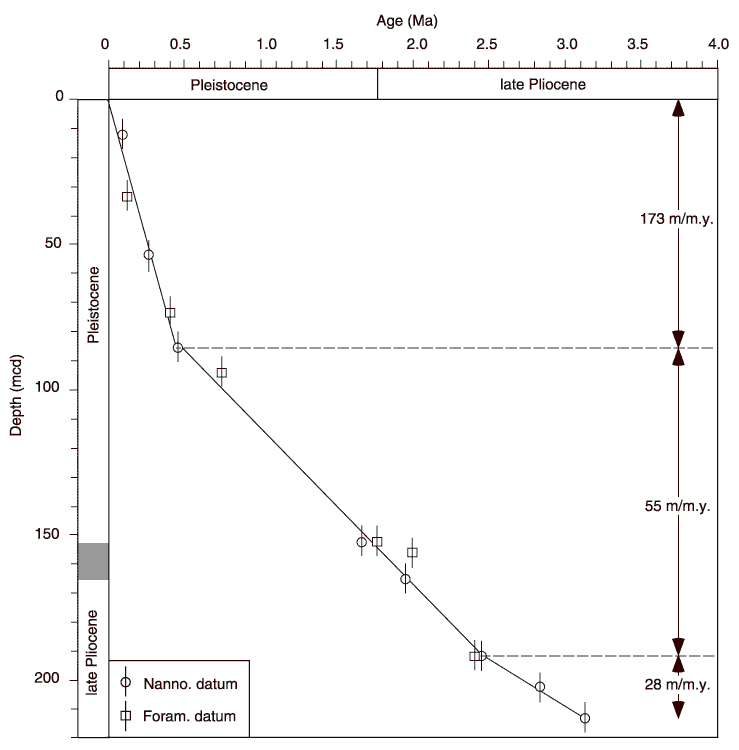
Figure F10. Hole 1145A age-depth plot. All biostratigraphic events are listed in Table T7. The average sedimentation rate is calculated based on three control points (control points are marked by * in Table T7). Dashed lines = control points selected to define intervals of linear sedimentation rates.

![]()