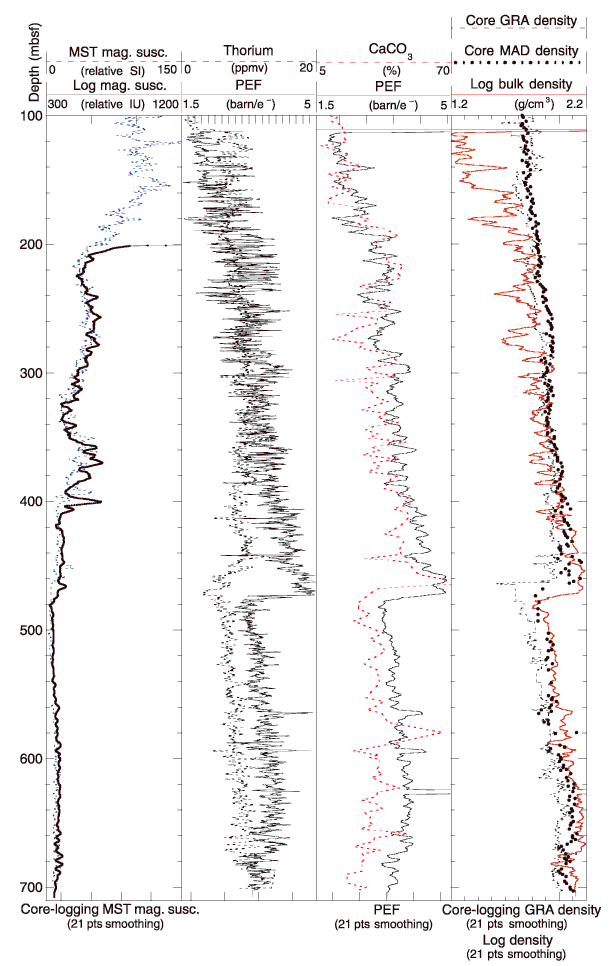
Figure F37. Comparison of magnetic susceptibility from core logging with the multisensor track (MST) and downhole measurements (pass 1 of the GHMT tool string), of thorium measured by the NGT tool string and photoelectric effect (PEF) from the HLDS, of CaCO3 from core samples and PEF, and of bulk density from downhole and core logging. GRA = gamma-ray attenuation, MAD = moisture and density, IU = instrument units.

![]()