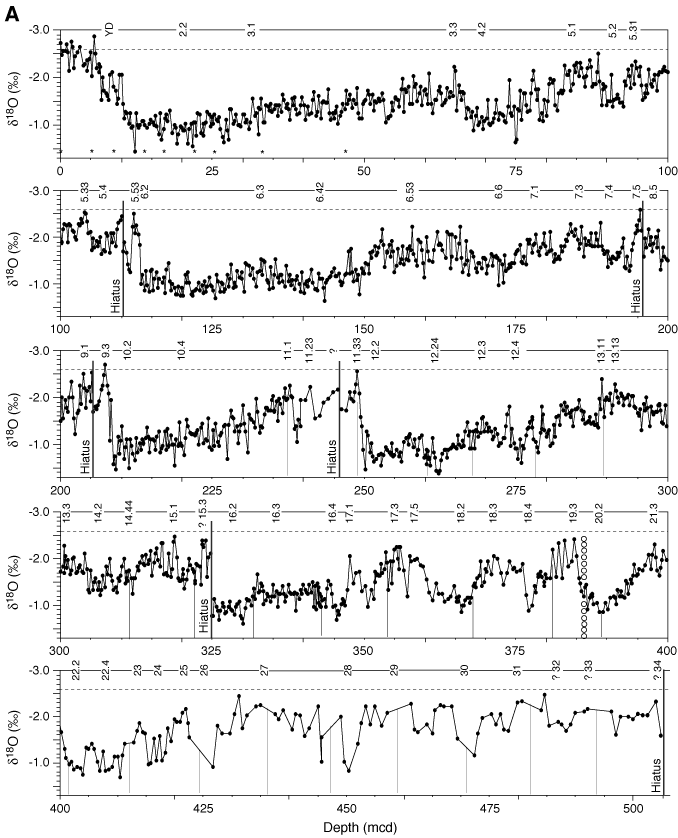
Figure F2. A. Oxygen isotope curve ( 18O ratio vs. Peedee belemnite standard) of surface-dwelling planktonic foraminifer Globigerinoides ruber from Site 1144. Sampling density is listed in Table T1. Dashed line at –2.6‰ indicates the Holocene average
  18O level. Numbers are marine isotope stages and/or substages. YD = Younger Dryas. Asterisks = position of 14C datings, line of open dots = microtektite layer. Solid vertical lines show position of hiatuses. Thin vertical lines below 235 mcd indicate core breaks.
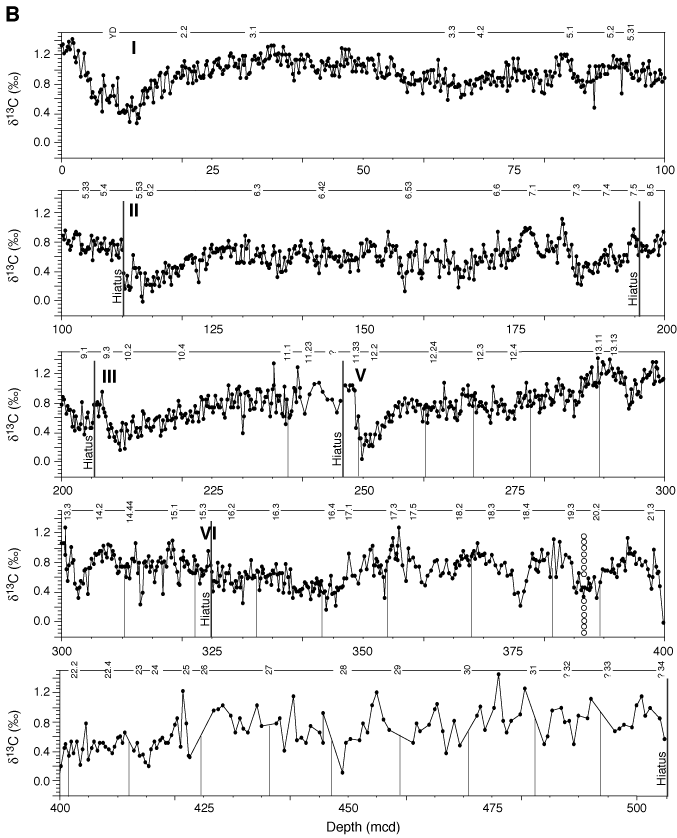
B. Carbon isotope record (
 13C
ratio) of surface-dwelling planktonic foraminifer G. ruber from Site
1144. Roman numerals show position of glacial terminations.


 18O ratio vs. Peedee belemnite standard) of surface-dwelling planktonic foraminifer Globigerinoides ruber from Site 1144. Sampling density is listed in Table T1. Dashed line at –2.6‰ indicates the Holocene average
  18O level. Numbers are marine isotope stages and/or substages. YD = Younger Dryas. Asterisks = position of 14C datings, line of open dots = microtektite layer. Solid vertical lines show position of hiatuses. Thin vertical lines below 235 mcd indicate core breaks.
B. Carbon isotope record (

![]()