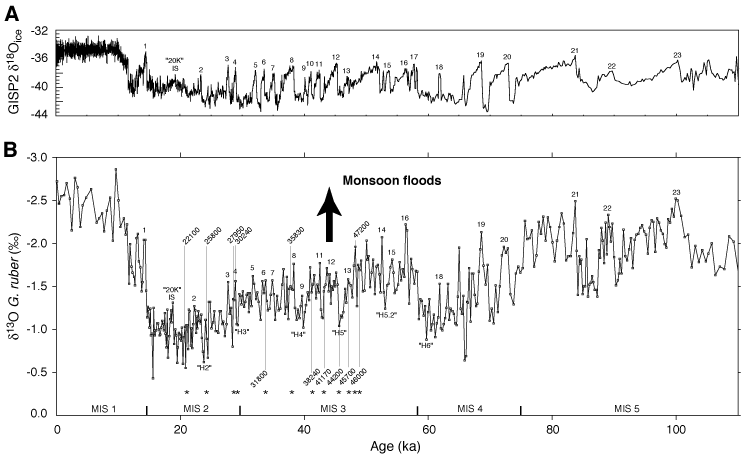
Figure F3. A. Oxygen isotope record of Greenland ice core GISP2 (Grootes and Stuiver, 1997) plotted against age. Numbers (1–23) indicate interstadials (IS). B. Site 1144 planktonic  18O record for the uppermost 108 mcd plotted against age. Thin lines define boundaries between marine isotope Stages (MIS) 1–5. Numbers (1–23) correlate planktonic
  18O minima to IS in the GISP2
  18O record (A). "20K"IS marks
  18O minimum that parallels a GISP2 warming near 20 ka. H1 through H6 identify high-salinity events coeval with North Atlantic Heinrich events. YD = Younger Dryas. Asterisks = position of 14C-datings after conversion into calendar ages (see Table T1). Massive arrow points toward a reduction in sea-surface salinity (SSS), interpreted as result of monsoon floods (1 = ~2‰
SSS).


 18O record for the uppermost 108 mcd plotted against age. Thin lines define boundaries between marine isotope Stages (MIS) 1–5. Numbers (1–23) correlate planktonic
  18O minima to IS in the GISP2
  18O record (A). "20K"IS marks
  18O minimum that parallels a GISP2 warming near 20 ka. H1 through H6 identify high-salinity events coeval with North Atlantic Heinrich events. YD = Younger Dryas. Asterisks = position of 14C-datings after conversion into calendar ages (see Table T1). Massive arrow points toward a reduction in sea-surface salinity (SSS), interpreted as result of monsoon floods (1 = ~2‰
SSS).

![]()