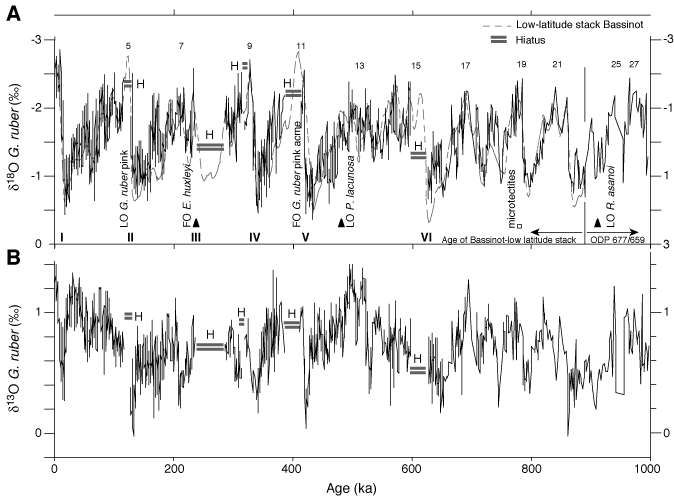
Figure F4. Site 1144 (A) oxygen and (B) carbon isotope curves (black lines) of planktonic foraminifer G. ruber (white) vs. age. Numbers indicate marine isotope stages based on a correlation with orbitally tuned age models of Marion Dufresne core MD90-0963 and ODP Sites 659/677 (Bassinot et al., 1994; Tiedemann et al., 1994) (gray curve behind  18O record). Roman numerals = number of major glacial terminations. Double horizontal bars show extent of hiatuses (H). Biostratigraphic first (FO) and last (LO) occurrence datums are marked; open triangle = planktonic foraminifer first/last occurrence datum, solid triangle = nannoplankton and radiolarian first/last occurrence datum. Square = position of microtektite layer.