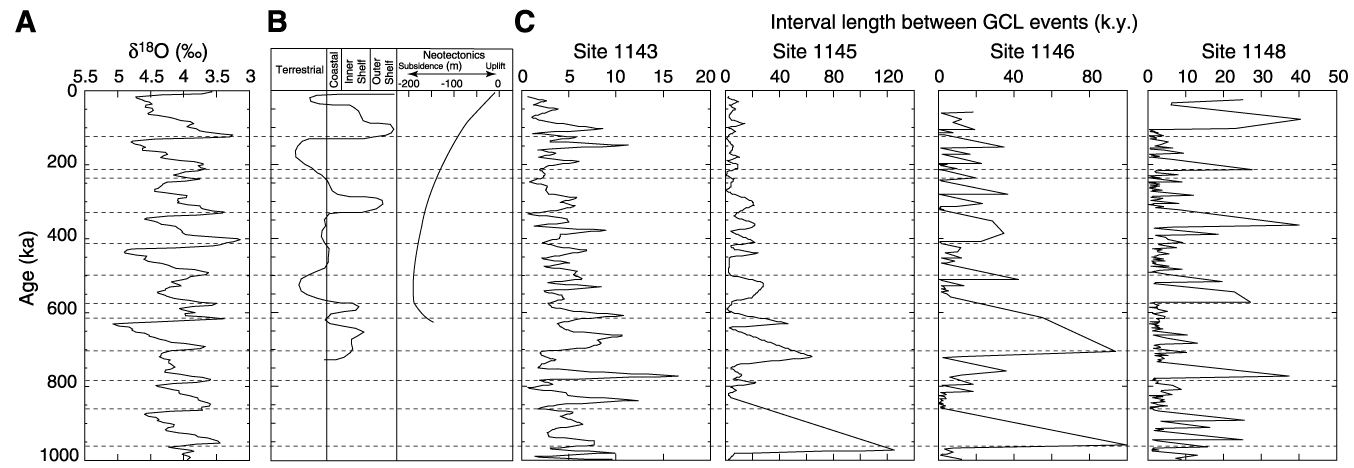
Figure F5. From the left, (A) oxygen isotopic curve of Cibicidoides wuellerstorfi from ODP Site 849, eastern equatorial Pacific (Mix et al., 1995), (B) neotectonics and relative sea level curves obtained by Lüdmann et al. (2001) from seismic data from the northern margin of the South China Sea, and (C) interval length between green clay layers (GCLs) at the investigated Leg 184 sites vs. time. The dotted lines indicate interglacial periods and in many cases correlate to longer intervals between GCL events (see text for explanation).


![]()