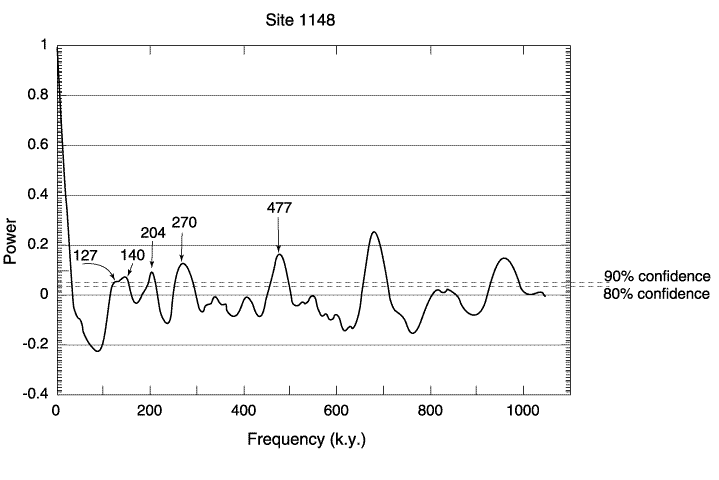
Figure F6. Autocorrelogram of interval lengths between green clay layers (GCLs) for Site 1148. The two dotted lines represent significance levels at 80% and 90%, calculated as g = 1 - e[(lnp - lnm)/m-1], where p = level of significance and m = (number of observations)/2. The choice of relatively low significance levels was determined on the consideration that during onboard observation and recording of the GCLs, both continuous and bioturbated layers were counted. Signals at 127, 140, 204, 270, and 477 k.y. are statistically significant. Other peaks (frequencies >500 k.y.) were not taken into account because they were statistically insignificant. Values of 140, 204, and 477 k.y. are close to heterodynes (difference) of different eccentricity terms (Berger and Loutre, 1991).


![]()