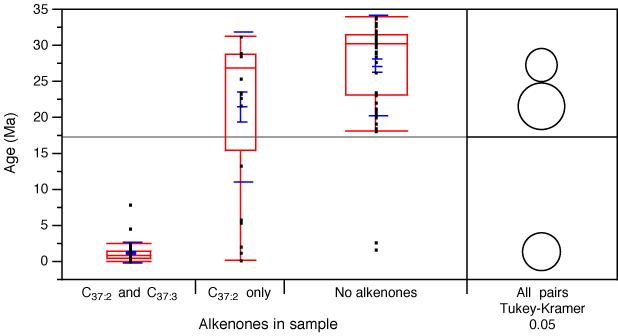
Figure F4. A statistical analysis of alkenones in sediments from Sites 1147 and 1148 for the last 35 m.y. Samples were divided into three categories: C37:2 and C37:3, C37:2 only, and no detectable alkenones. Black dots = individual samples, narrow horizontal bars = means and standard deviations, rectangles = the interquartile range, horizontal bars within the rectangles = median ages. Variance for C37:2 and C37:3 and no detectable alkenones is quite small, whereas variance for C37:2 only spans a wider range. Because the variances are unequal across the groups, a Tukey-Kramer honestly significant difference test for all pairs (the circles on the right) shows that the mean ages for each category are significantly different (Sall et al., 2001).