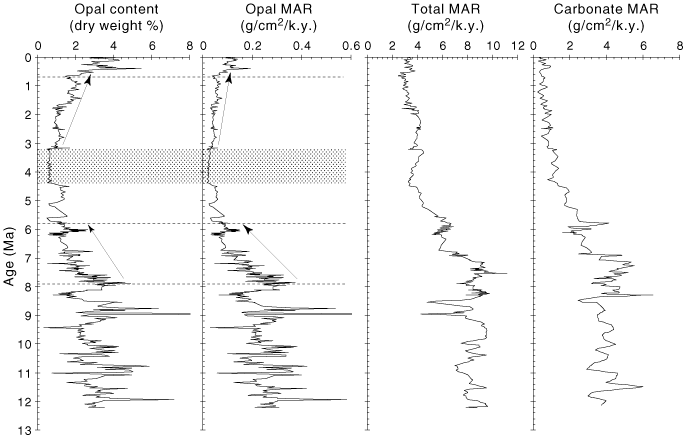
Figure F2. Changes of opal content and mass accumulation rate (MAR) and total and carbonate MARs at Site 1143, southern South China Sea. Hatched area = lowest interval of opal content and MAR. Dashed lines = the change boundaries of opal content and MAR.


![]()