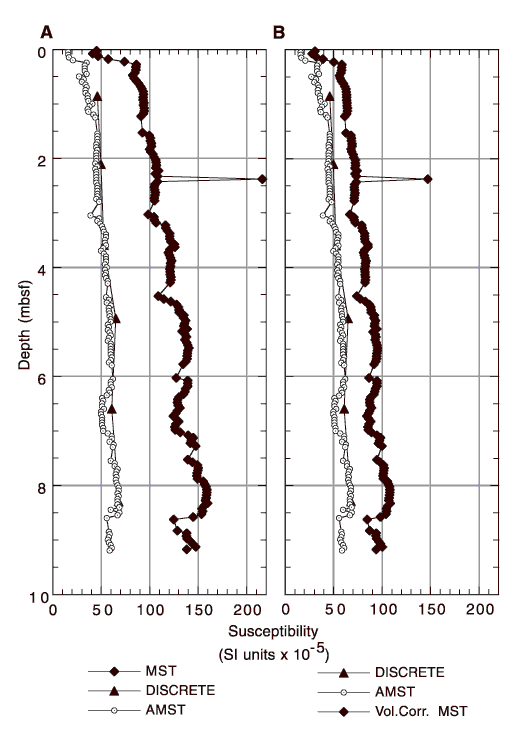
Figure F10. A. Whole-core (MST), half-core (AMST), and discrete sample measurements of susceptibility from Core 185-801D-1W. B. MST data corrected according to the Bartington correction formula and plotted with the AMST and discrete sample data of A.

![]()