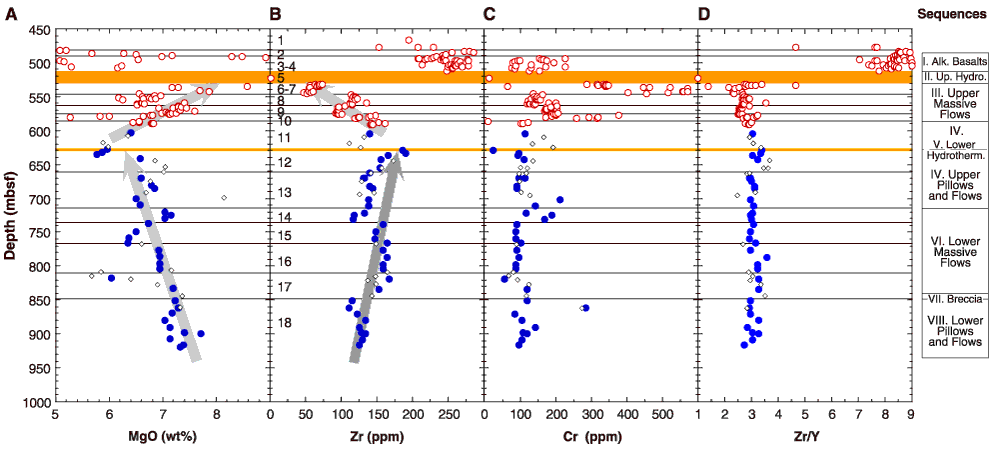
Figure F37. MgO, Cr, Zr, and Zr/Y plotted vs. depth at Site 801. Red (open) circles = data from Castillo et al. (1992); blue (solid) circles = the least-altered subset of shipboard XRF analyses from Leg 185; open diamonds = samples with >1 wt% K2O and/or >2% LOI. Horizontal orange bands (shaded) represent the locations of upper and lower hydrothermal deposits. Horizontal lines and numbers on Zr plot illustrate geochemical units. Shaded arrows emphasize general geochemical trends in basement.

![]()