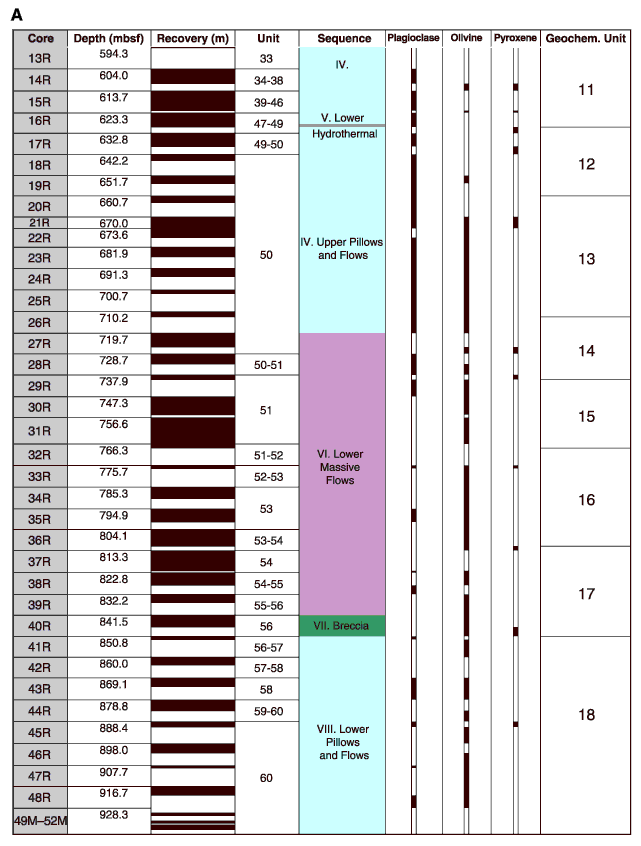
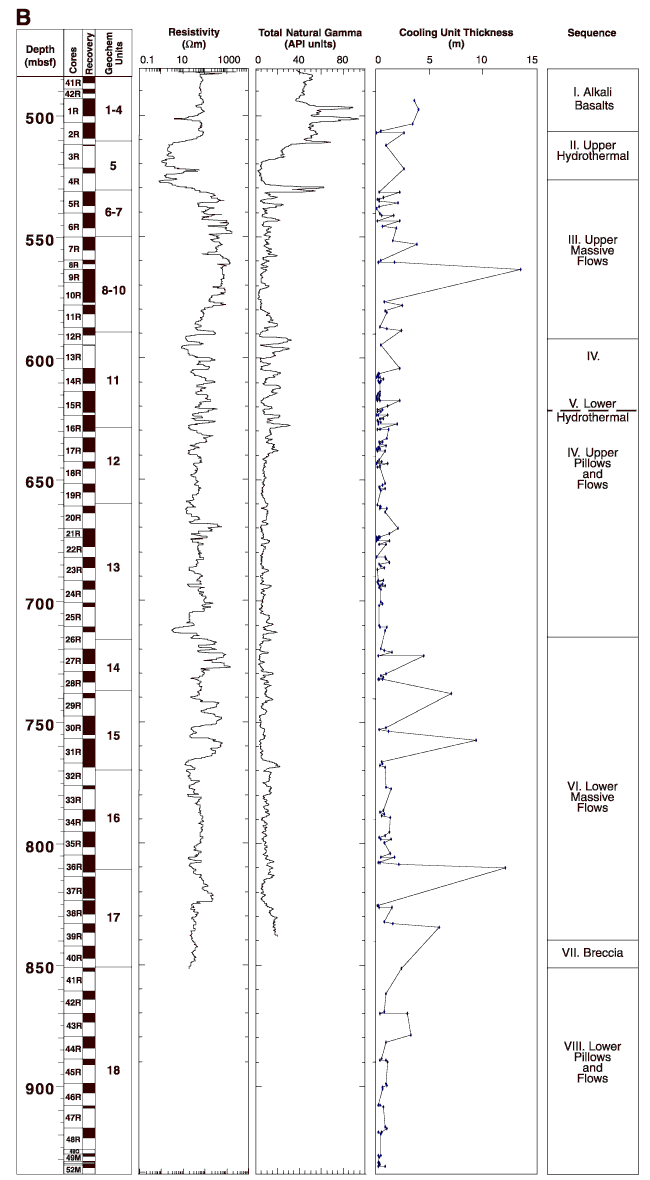
Figure F5. A. Hole 801C lithologic summary illustrating core recovery (black = recovered material; white = unrecovered material), lithologic units, major sequences, and geochemical units. Broad changes in the lithology, or primary igneous structure, are illustrated in the sequence column. The distribution of phenocryst mineralogy (estimated in hand specimen and shown by a black bar) and the geochemical units (based on shipboard X-ray fluorescence analyses) are also included. B. Cooling unit thickness with depth downhole, plotted alongside the resistivity and total natural gamma logs.


![]()