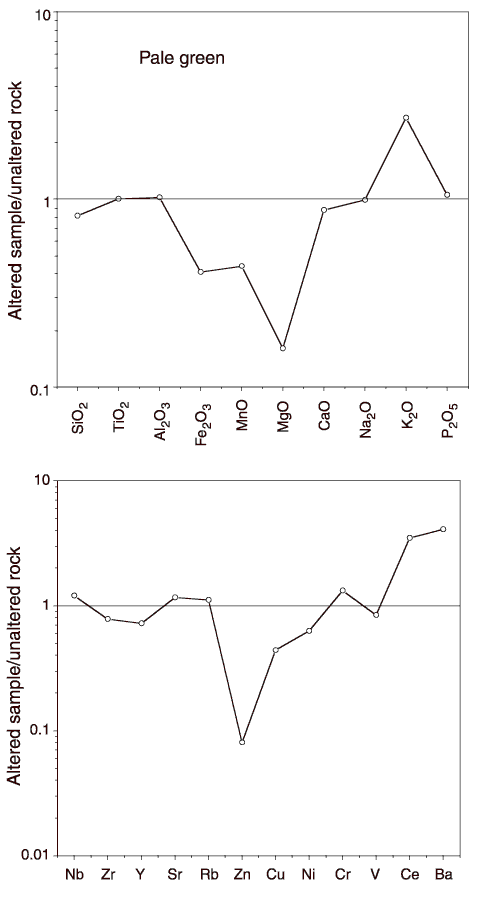
Figure F53. Chemical composition of intensely altered pale green sample (Sample 185-801C-15R-7, 72-74 cm). Sample composition is normalized to constant Ti and Al relative to mean least-altered rock from the same geochemical unit; plotted values are the ratio of the altered sample to the mean least-altered rock.

![]()