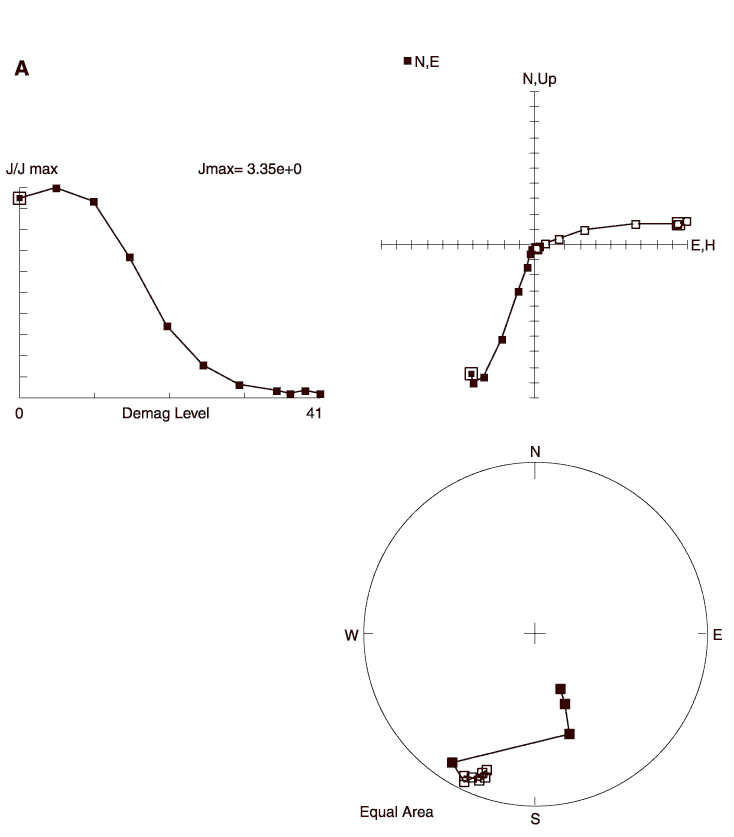
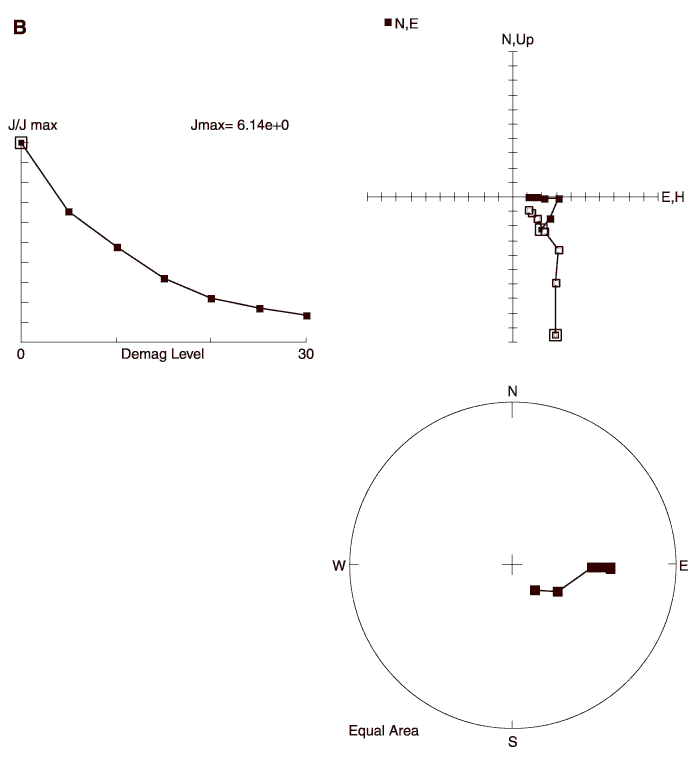
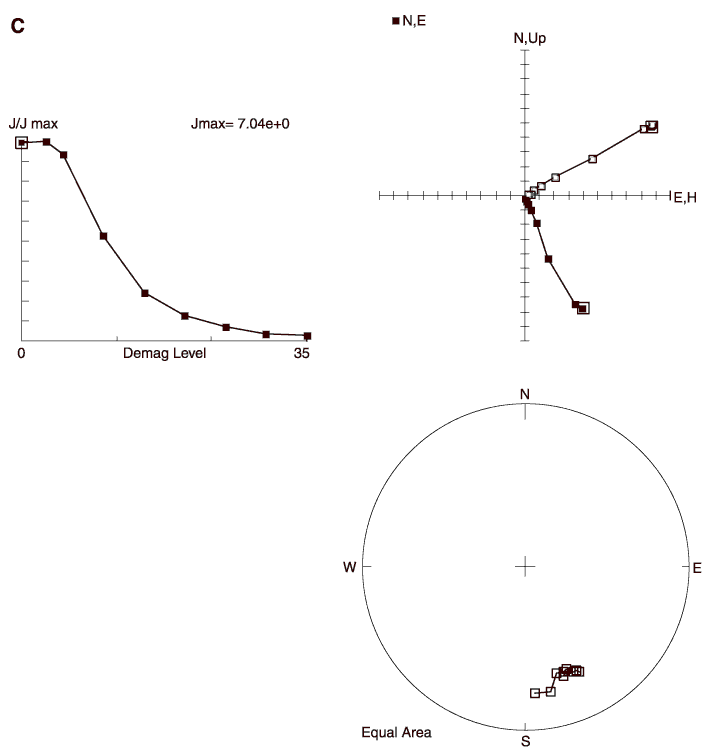
Figure F61. Demagnetization diagrams showing the effect of AF treatment. The J/Jmax diagram displays the demagnetized sample intensity normalized to the initial intensity for increasing strengths of the alternating field (plotted in milliteslas). The orthogonal axes diagram displays the change of intensity and direction for the vertical (open symbols) and horizontal (solid symbols) components of the magnetic vector. The stereographic projection displays the change in magnetic vector with increasing demagnetization on the upper (open symbols) or lower (solid symbols) hemispheres of an equal-area stereographic projection. A. Typical normal-direction samples. B. Reversed-direction samples. C. Transitional-direction samples.


![]()