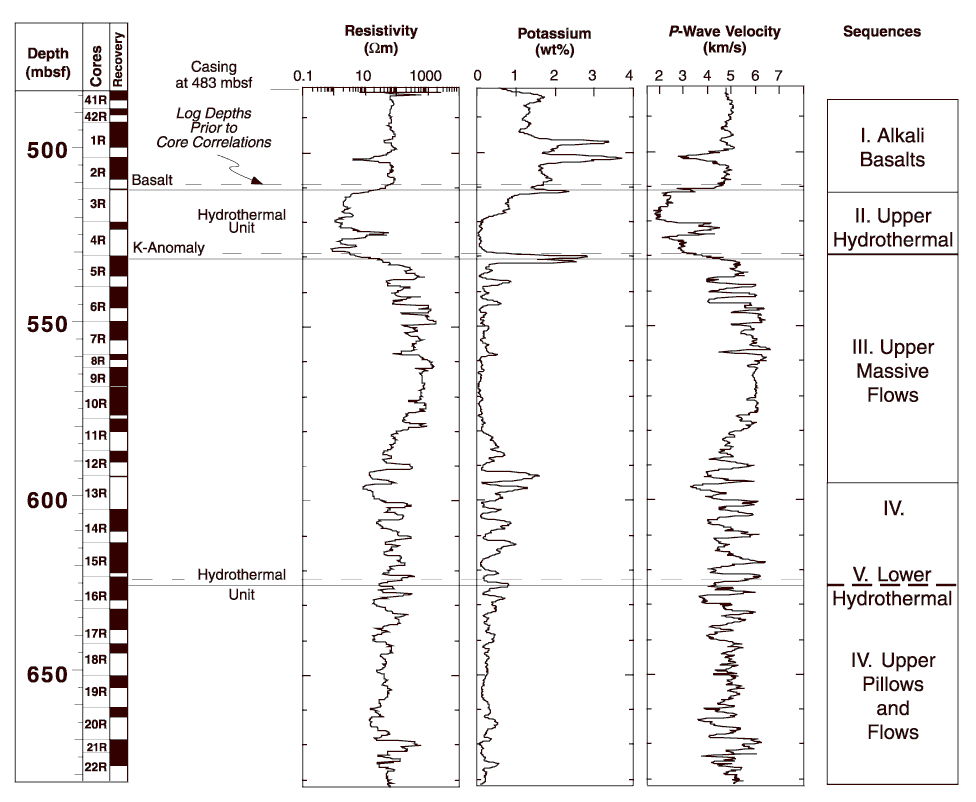
Figure F68. Cores and cored intervals correlated to logs by shifting the logs down 2 m from their originally recorded levels. Solid horizontal lines indicate the correlations of specific features observed in both the cores and logs after the logs were shifted down by 2 m relative to the cores. The dashed line above each solid line indicates the former position of these logged features relative to the cores before the downshift.

![]()