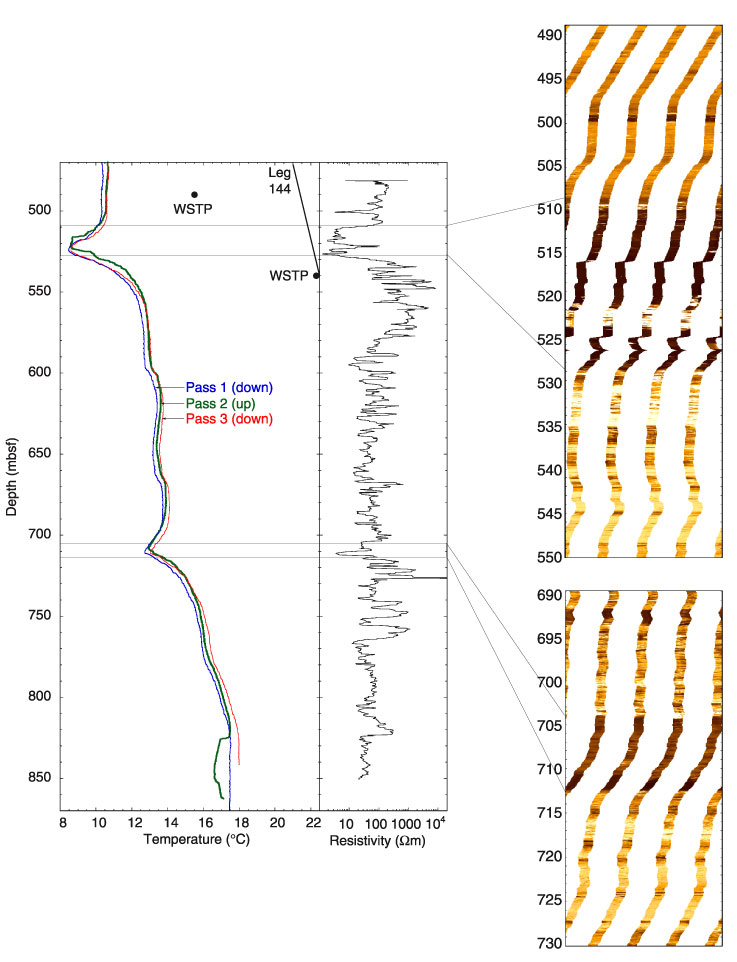
Figure F73. Downhole temperature and FMS data illustrating the correspondence of temperature anomalies with portions of the borehole with low resistivities. The solid dots at 480-590 mbsf are temperature measurements obtained from the WSTP before drilling. The solid black line is the temperature gradient measured during Leg 144 (Larson et al., 1993).
![]()