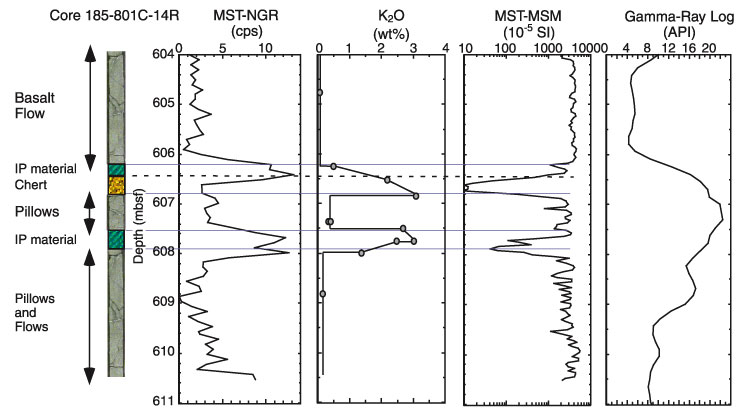
Figure F91. Comparison of MST-NGR data, K2O measurements on core samples, MST-MS data, and downhole gamma-ray logs for Core 185-801C-14R. The lithologic column on the left is schematic and not an actual core photo. Lines show the locations of sediment and precipitated interpillow material (IP), which correspond closely to the measured high K2O values, high gamma-ray signals, and low MS measurements.
![]()