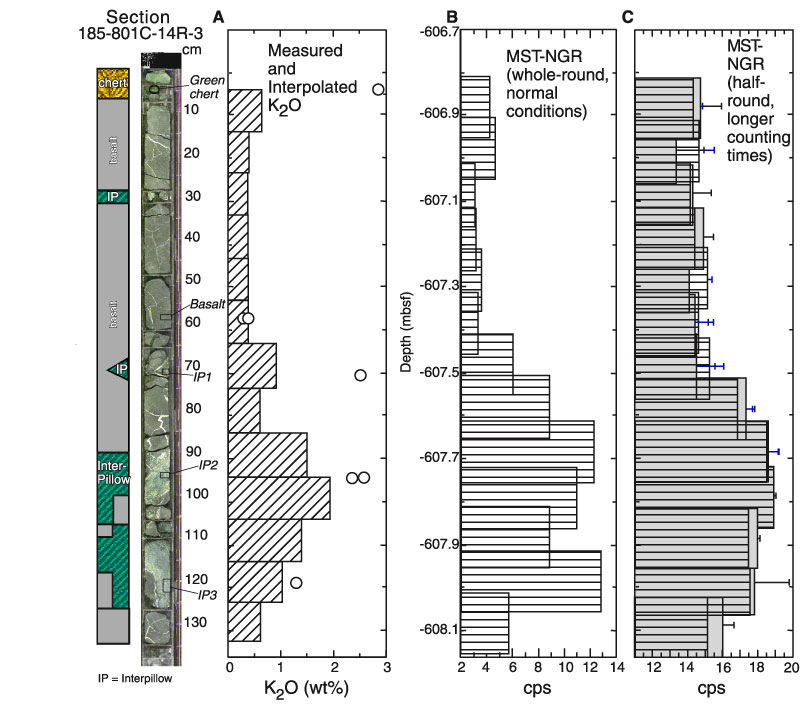
Figure F92. MST-NGR and core K2O data for Section 185-801C-14R-3. Schematic lithologic column and section photo are on the left, with discrete AA samples indicated. A. Actual AA K2O measurements are shown as large open circles (data in Table T23). Interpolated K2O (bars with diagonal fill) are calculated by apportioning discrete analyses over 10-cm intervals (see Table T24 for proportions) such that they are comparable to the footprint of the MST measurements. B. Routine MST-NGR measurements (whole-round with 20-s readings every 10 cm). C. Half-round data for longer counting times. The striped bars are the average and standard deviation of two MST passes with 60-s readings every 10 cm, and the gray bars are the same for three MST passes with 20-s readings.
![]()