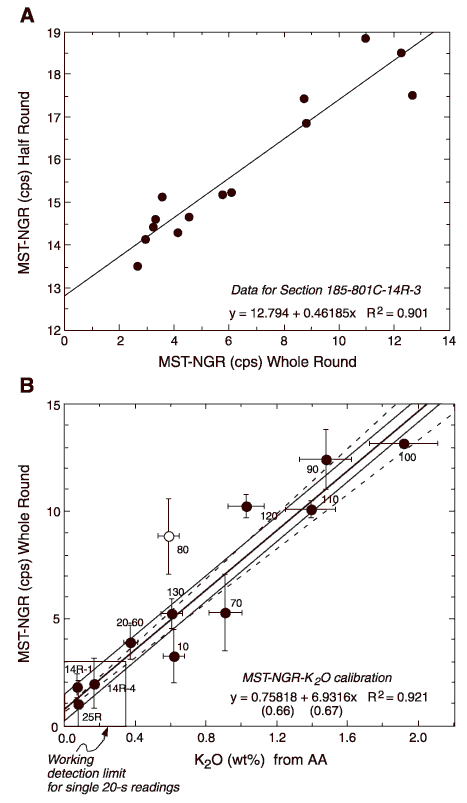
Figure F93. A. Relationship between whole-round and half-round core MST-NGR measurements on Section 185-801C-14R-3. The whole-round data are corrected for background counts (11.75 cps), whereas the half-round data are not. The equation for a best-fit line is given and used to correct half-round measurements to whole-round counts per second. B. Calibration of MST-NGR to K2O concentration, based on data in Table T24. Error bars on individual points are from 10% uncertainty in AA measurements and one standard deviation of the MST readings. Calibration assumes all natural gamma-ray counts are due to K2O (and not U and Th). The linear regression is shown (thick line), including errors on the intercept (thinner lines) and slope (dashed lines). Uncertainties in regression are given in parentheses; the total uncertainty region is shown in the shaded area. At low count rates, most of the uncertainty is in the intercept. Point at 80 cm is excluded from the regression.

![]()