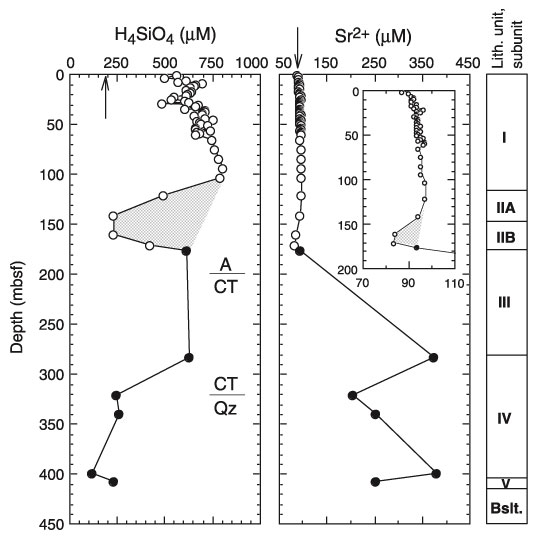
Figure F52. Concentration profiles of dissolved silica and Sr2+ at Site 1149. Open circles = Hole 1149A; solid circles = Hole 1149B. Lithostratigraphic units and subunits are as defined in "Lithostratigraphy" in "Sedimentology". Shaded regions indicate the position of the suggested clay alteration zone of Subunits IIA and IIB. Inset in the right-hand panel shows the 0-200 mbsf portion at an expanded concentration scale. "A/CT" and "CT/Qz" indicate positions of first and last occurrence of opal-CT (also see "Unit III" and "Unit IV" in "Sedimentology"). Arrows indicate average concentrations in seawater (Millero and Sohn, 1992) (for silica this value is the highest of a given range).
![]()