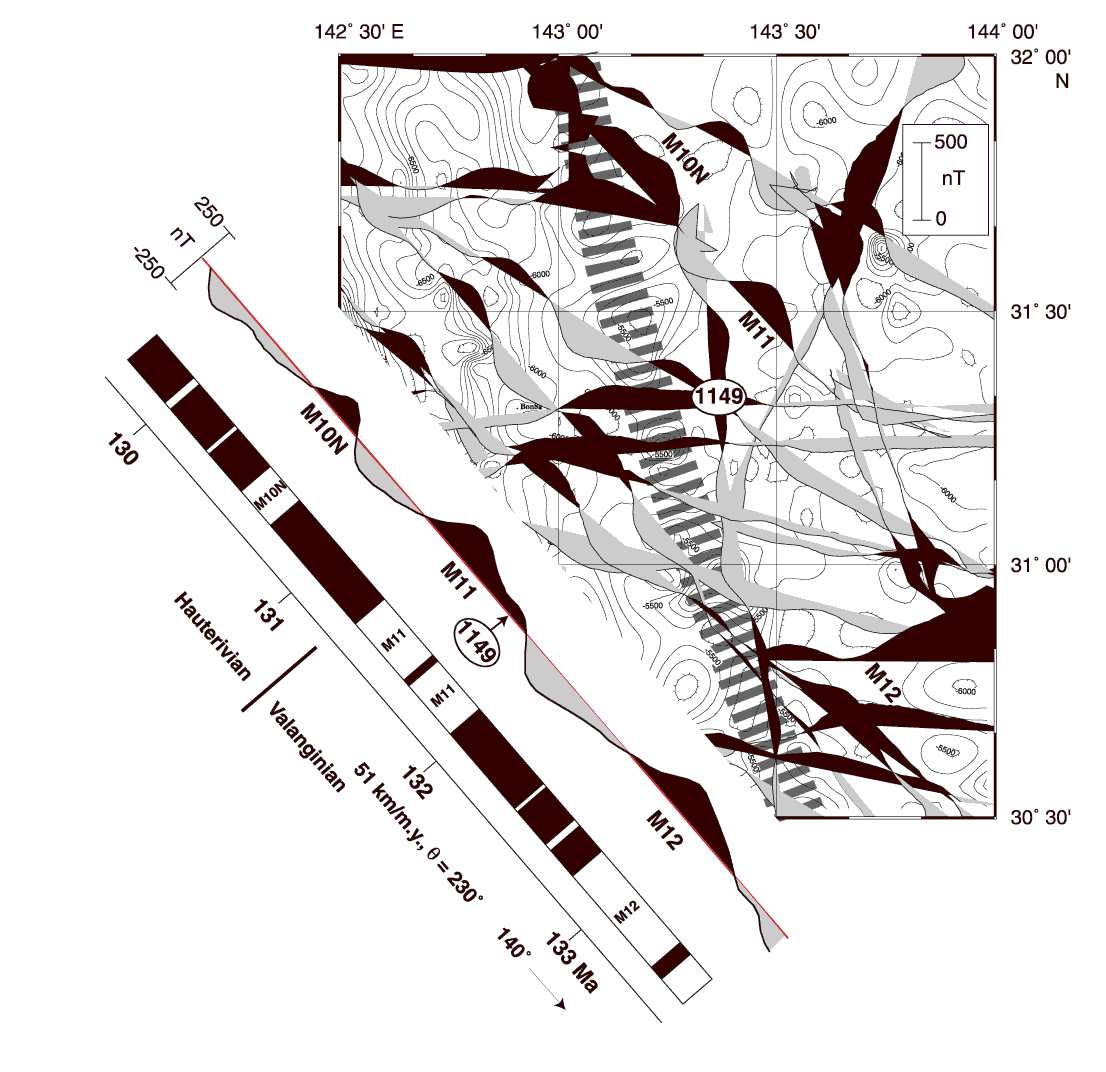
Figure F6. Magnetic anomalies and predicted bathymetry in the vicinity of Site 1149. Contour interval = 100 m. Magnetic anomalies are plotted along ship tracks with positive anomalies shown in black and negative anomalies in gray. Model magnetic anomaly profile calculated to match the lineated magnetic Anomalies M10N, M11, and M12 on the chart. Black blocks are normally magnetized, and white blocks are reversely magnetized. The magnetic reversal and biostratigraphic time scale are from Channell et al. (1995). Model parameters: spreading half rate = 51 km/m.y.; skewness = 230°; and trend of profile toward older anomalies = 140°.

![]()