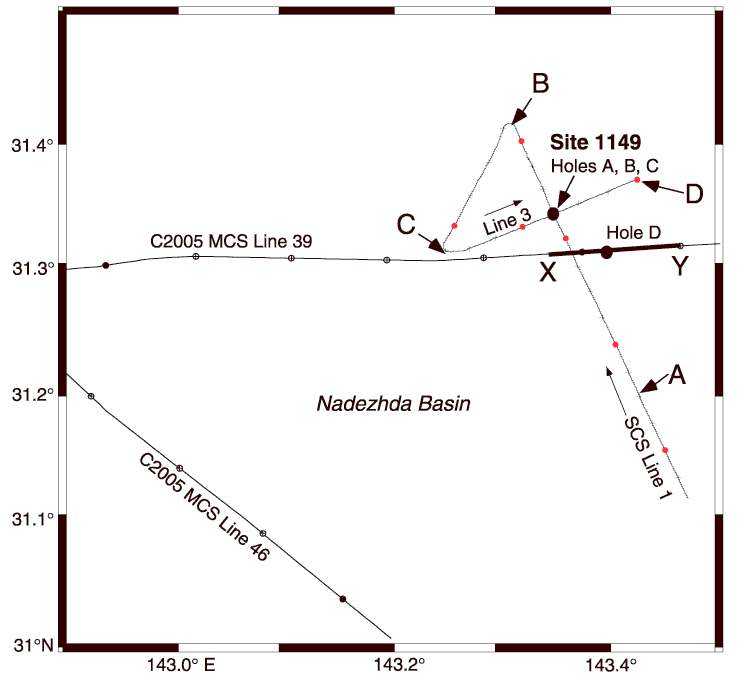
Figure F7. Track chart of the entire SCS survey conducted during Leg 185 (SCS Lines 1, 2, 3) and portions of C2005 MCS Lines 39 and 46. The end points of the seismic profiles shown in Figures F3 and F8 are marked in capital letters (A-B, C-D, X-Y). Solid circles locate hole positions.

![]()