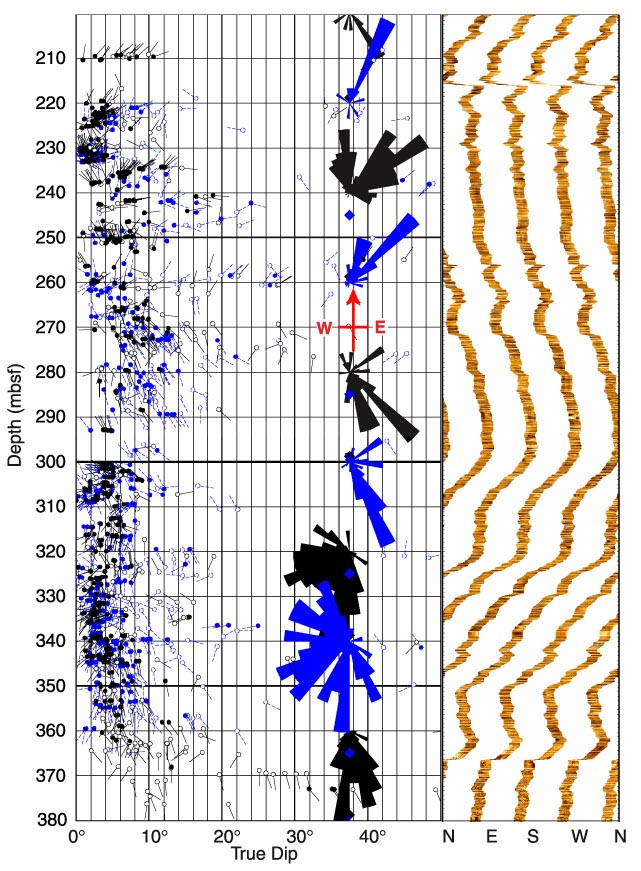
Figure F75. Dipmeter analysis and FMS images recorded between 200 and 380 mbsf in Hole 1149B. The analysis of pass 1 is in black (solid-line tails) and pass 2 in blue (dashed-line tails). The downdip azimuths and the dip values are indicated by the direction of the tadpole's "tails" and by the position in the grid. Hollow tadpoles indicate lower confidence in the quality of the correlation. The "fan plots" give the distribution of the dip azimuth over 20-m intervals.
![]()