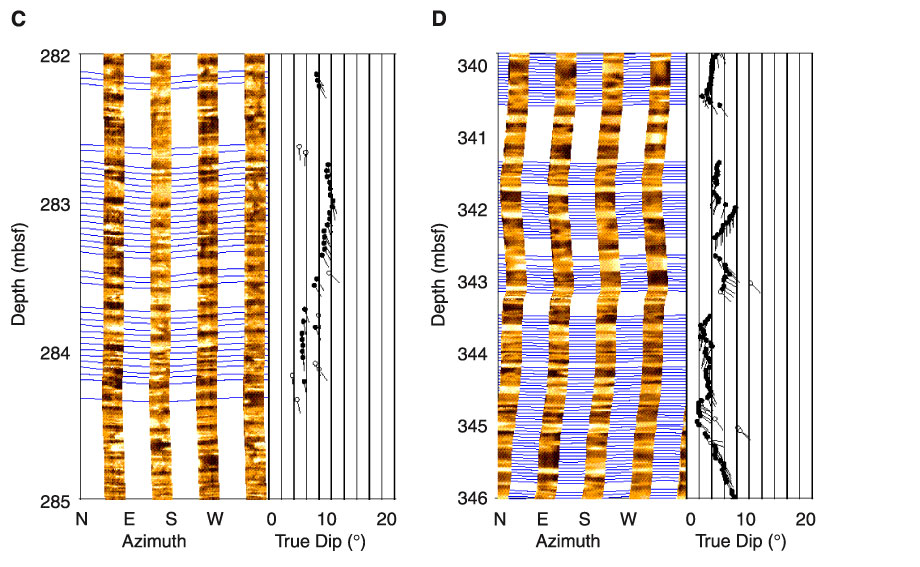
Figure F76. Detail of the FMS images and dip analysis in four intervals, showing the change occurring in the sediment structure at the bottom of Unit III. A, B. Above the transition. The sinusoids show the correlation paths between the different FMS pads that identify individual dipping features. C, D. Below the transition.

![]()