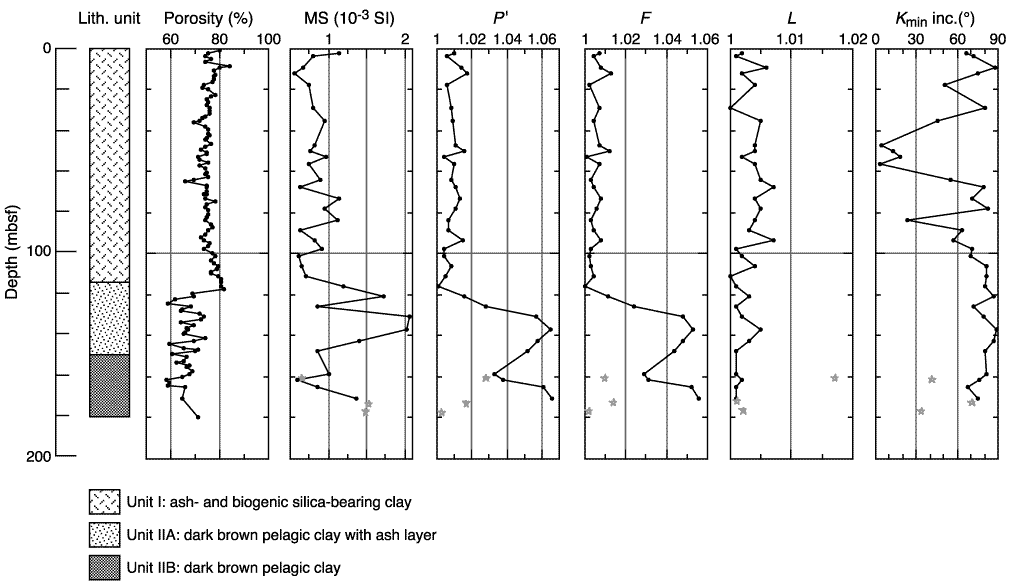
Figure F3. Profiles of magnetic susceptibility (MS), AMS parameters, and Kmin inclination with depth. Dots and solid lines show data from Hole 1149A, and gray stars show data from Hole 1149B. From left side of figure, magnetic susceptibility profile, P´ value (anisotropy degree of MS) profile, F value (foliation degree) profile, L value (lineation degree) profile, and Kmin (minimum direction of MS) inclination profile.


![]()