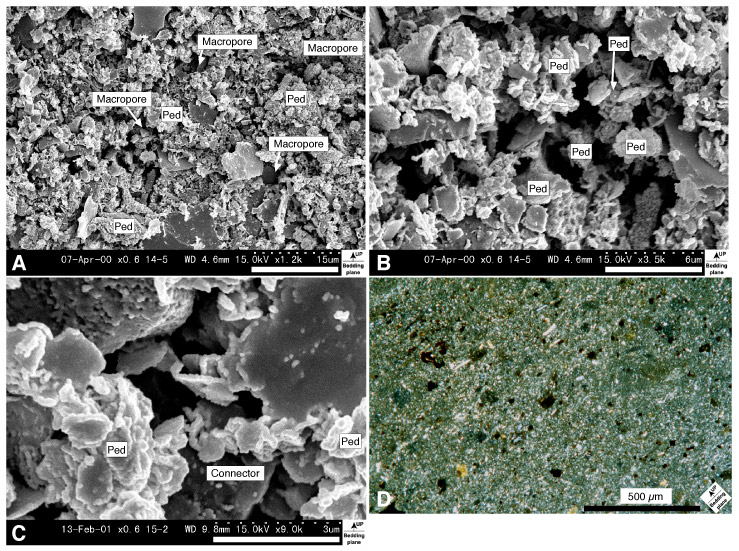
Figure F9. Microfabrics of Subunit IIA. A. General view showing random and porous fabric from core at 125.30 mbsf (Sample 185-1149A-14H-5, 110-112 cm); vertical view, secondary electron image. B. Close-up image of center of A. Peds are linked by clay platelets in EF contacts; vertical view, secondary electron image. C. Connectors, which are chain linked by each clay platelet in EF contact, at 125.30 mbsf (Sample 185-1149A-14H-5, 110-112 cm); vertical view, secondary electron image. D. Fabric showing preferred orientation of clay platelets from core at 125.30 mbsf (Sample 185-1149A-14H-5, 110-112 cm); vertical view, crossed
nicols.