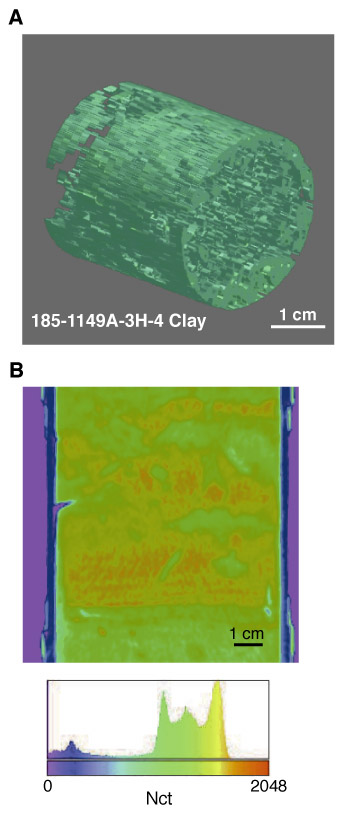
Figure F6.
A
. Three-dimensional X-ray CT image of a whole-round clay sample (Sample 185-1149A-3H-4, 130-140 cm).
B
. Vertical (z) cross section of the sample with CT number (Nct) color scale. Blue = low attenuation, red = high attenuation.