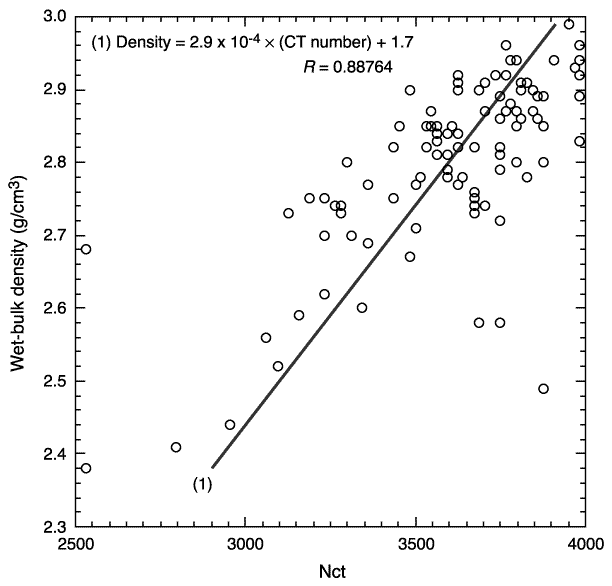
Figure F8. Crossplot of average CT numbers (Ncts) from all cube samples (see Tables T1, T2) and shipboard wet bulk density (Shipboard Scientific Party, 2000a; see Table
T11 in the "Site 801" chapter). One different least-squares regression line is shown in this graph.


![]()