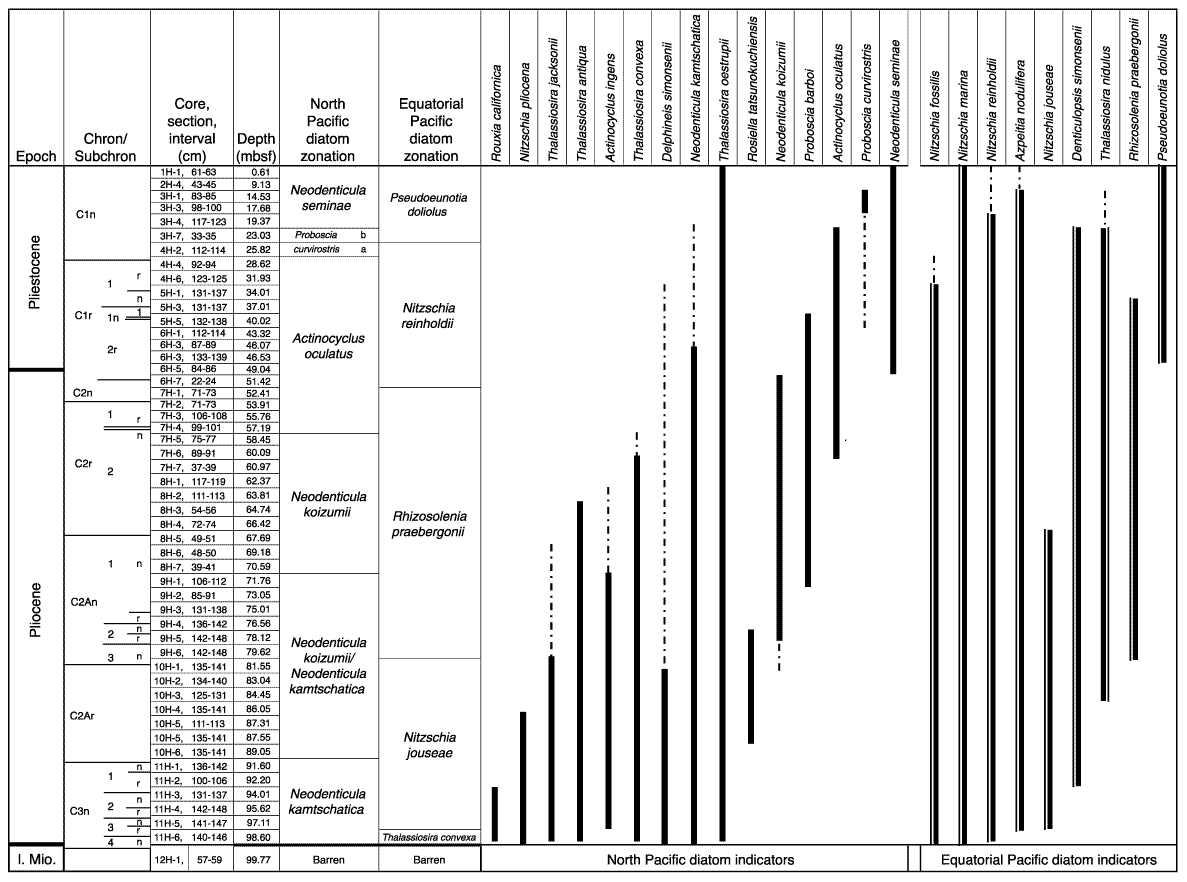
Figure F2. Stratigraphic ranges in Hole 1149A for some key zonal marker species. Solid lines = intervals where a particular species was abundant, common, or frequent ( 1%). Dashed lines = intervals where a species was rare or where an interval barren of a particular species were connected by two rare occurrences. Depths = the position of samples examined during the study.


![]()