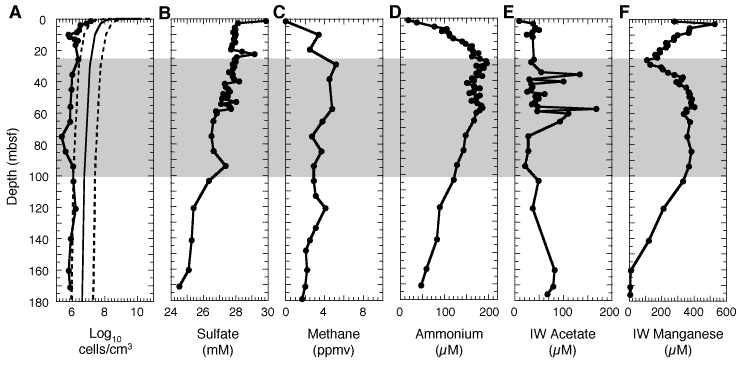
Figure F1. Depth profiles. A. Total bacteria at Site 1149 using the acridine orange direct count technique. Solid sloping line = the regression line of best fit derived from 16 ODP legs of deep bacterial profiles, dashed lines = the 95% prediction limits (Parkes et al., 1994) and interstitial water (IW) geochemistry. B. Sulfate. C. Methane. D. Ammonium. E. Acetate. F. Reduced manganese. The shaded area highlights the broad peak in bacterial manganese reduction activity between 26 and 100
mbsf.


![]()