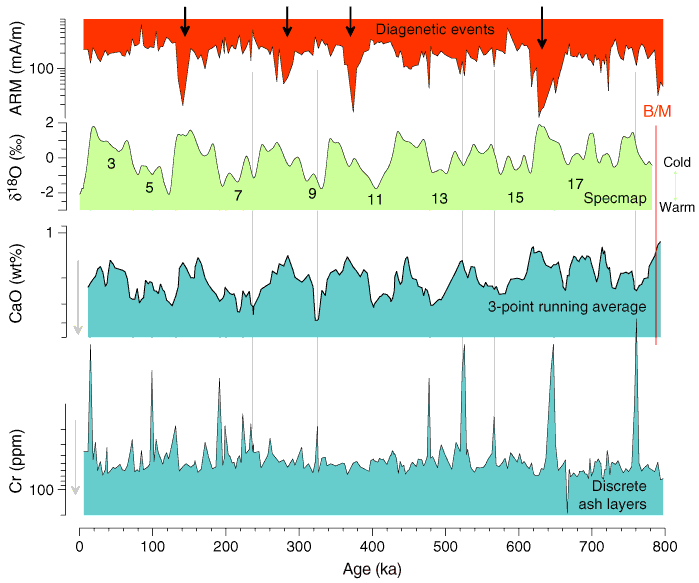
Figure F10. The correlation of the CaO record from Hole 1149A to the SPECMAP stack (Imbrie et al., 1984) is used to convert depth to age. Numbers assigned to the SPECMAP curve indicate respective interglacial stages. Peaks in Cr (ppm) indicate the position of discrete ash layers, further highlighted by the thin vertical lines. Note that the vertical axis increases downward for Cr and CaO (wt%) (highlighted by the black arrow) for graphical reasons. Anhysteretic remanent magnetization (ARM) is shown to highlight intervals of dominant diagenetic alteration. Also see Figure F11. B/M = Brunhes/Matuyama boundary.


![]()