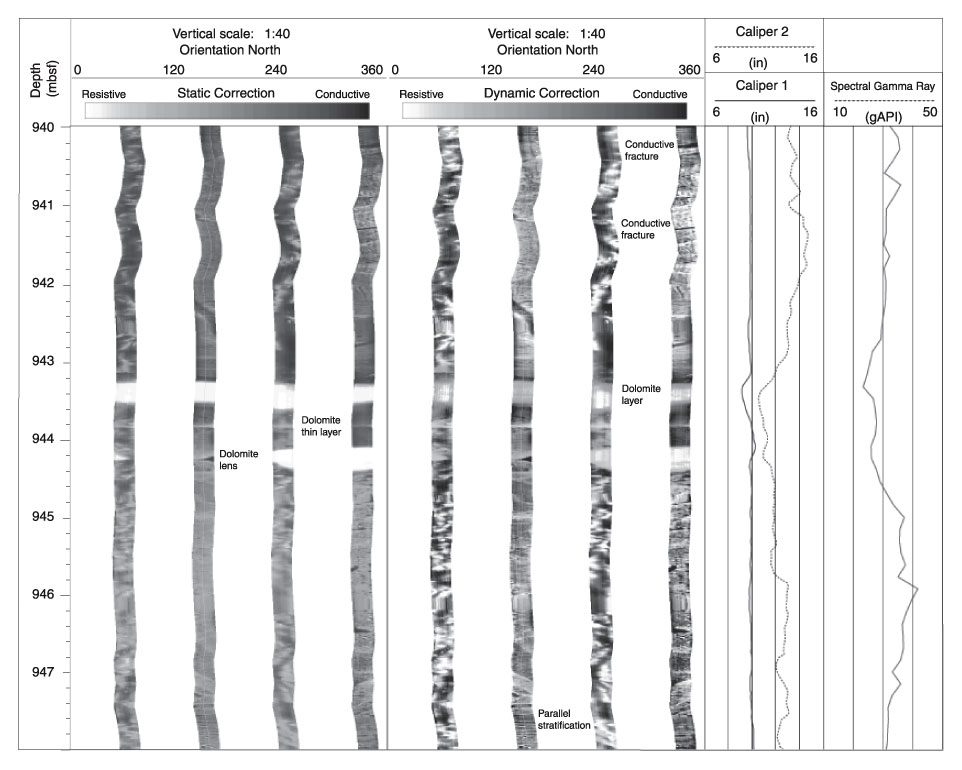
Figure F67. FMS images across a carbonate zone at 943.3-944.4 mbsf. This zone was correlated with a section in Core 186-1150B-26R and to major seismic reflector at CMP 2341 of cruise KH 96-3, Line 1. The FMS images show the carbonate zone consists of two parts: (1) relatively resistive beds with conductive features (bioturbation?) below, and (2) relatively conductive beds with fractures above. The images to the left are displayed with a range of resistivity values that are fixed for the entire logged interval ("static correction"); the images at the right allow for a greater range of grayscale to be displayed using normalized gains for a smaller user-specified depth interval (dynamic equalization). Both images are from 940 to 948 mbsf. gAPI = gamma-ray American Petroleum Institute.
![]()