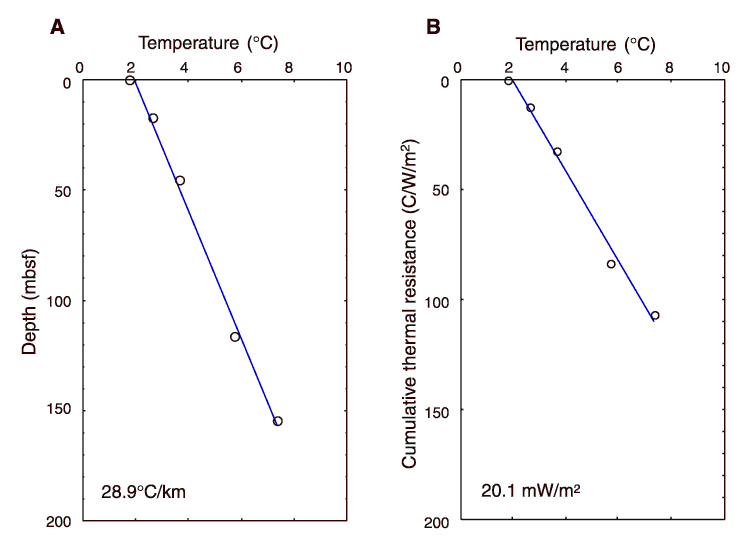
Figure F71. A. Temperature vs. depth at Site 1150. Thermal gradients are also shown. B. Temperature vs. cumulative thermal resistance and calculated mean heat flow.