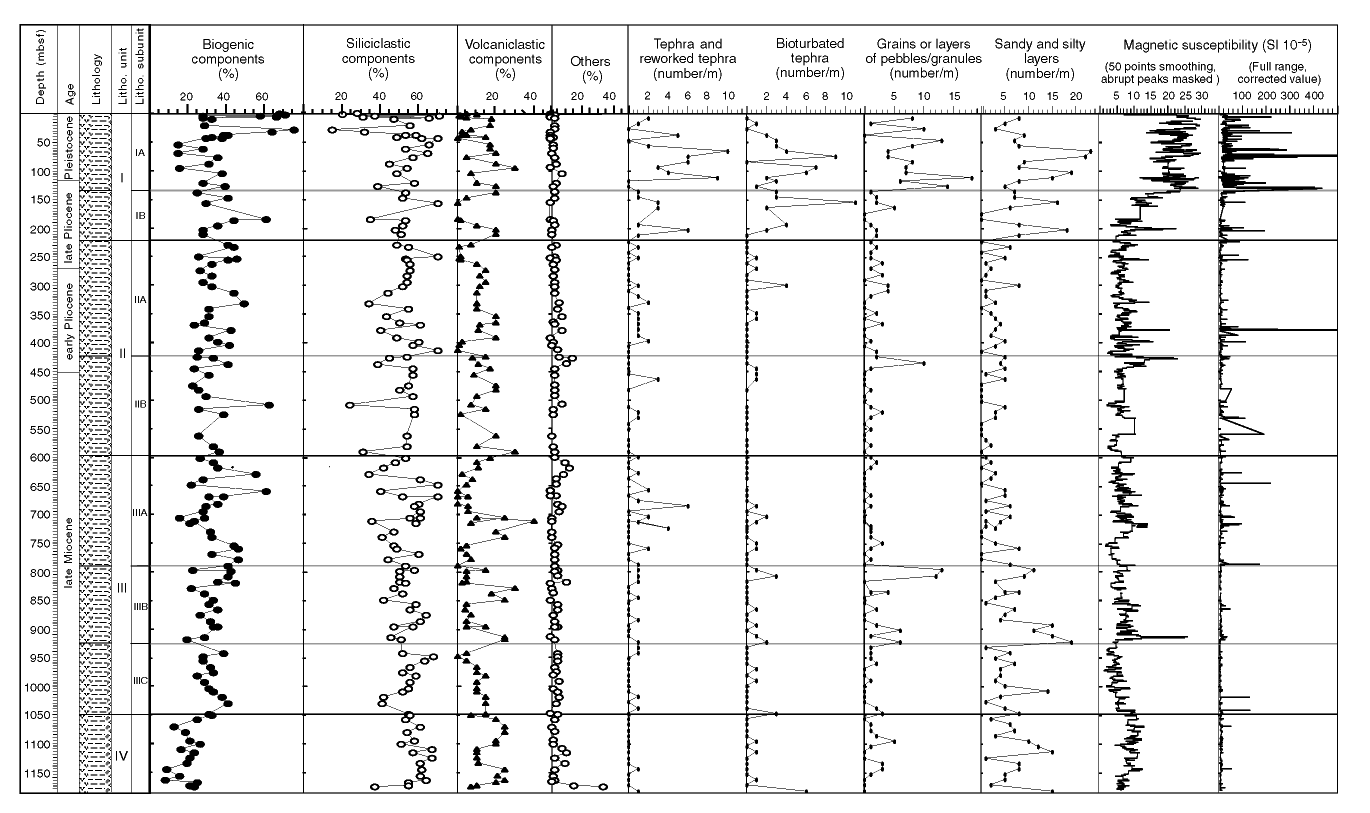
Figure F9. Downhole variations of biogenic, siliciclastic, and volcaniclastic sediments, and other components from smear-slide observations; variations of minor lithologies. Magnetic susceptibility data are plotted as raw corrected values and after smoothing and removing the peak values.

![]()