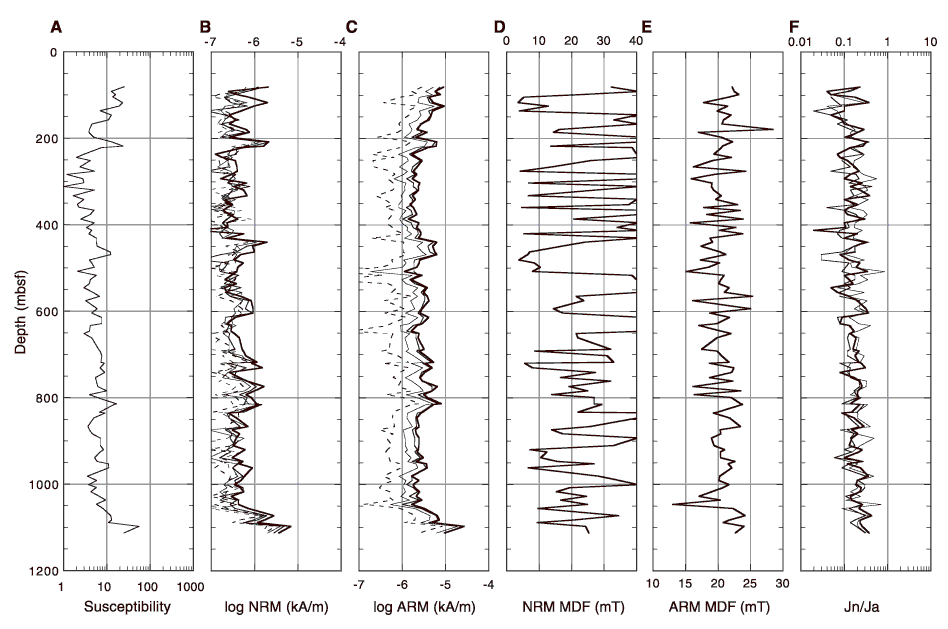
Figure F23. Discrete sample results from the NP2 spinner magnetometer. A. Susceptibility (raw meter values). B. Natural remanent magnetization (NRM) intensity. C. Anhysteretic remanent magnetization (ARM) intensity. D. Median destructive field (MDF) of the NRM. E. MDF of the ARM. F. The NRM intensity (Jn) divided by the ARM intensity (Ja). In the plots with multiple lines, the bold line is prior to demagnetization, the medium-thick line is after 10 mT demagnetization, the thin line is after 20 mT demagnetization, the thick dashed line is after 30 mT demagnetization, and thin dashed line is after 40 mT demagnetization.

![]()