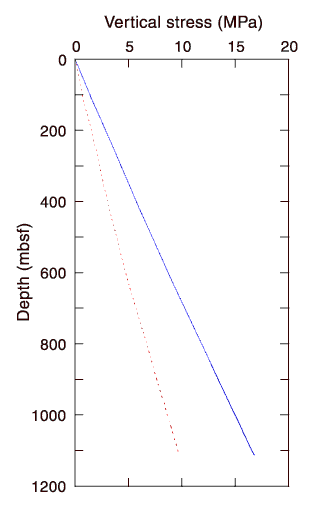
Figure
F37. Total and effective vertical stress vs. depth at Site 1151. Linear fit
of the data shows that the total and effective vertical stresses have the
following depth relationships: ![]() v
= -0.09218 + 0.014823 x
z (R >
0.999) and s v´
= -0.15056 + 0.0083804 x
z (R = 0.999),
where z =
depth. The weight of seawater (22.0 MPa) was excluded when the total vertical
stress was calculated. Blue solid line = total vertical stress (s v),
dotted red line = effective vertical stress (s v´)
v
= -0.09218 + 0.014823 x
z (R >
0.999) and s v´
= -0.15056 + 0.0083804 x
z (R = 0.999),
where z =
depth. The weight of seawater (22.0 MPa) was excluded when the total vertical
stress was calculated. Blue solid line = total vertical stress (s v),
dotted red line = effective vertical stress (s v´)

![]()