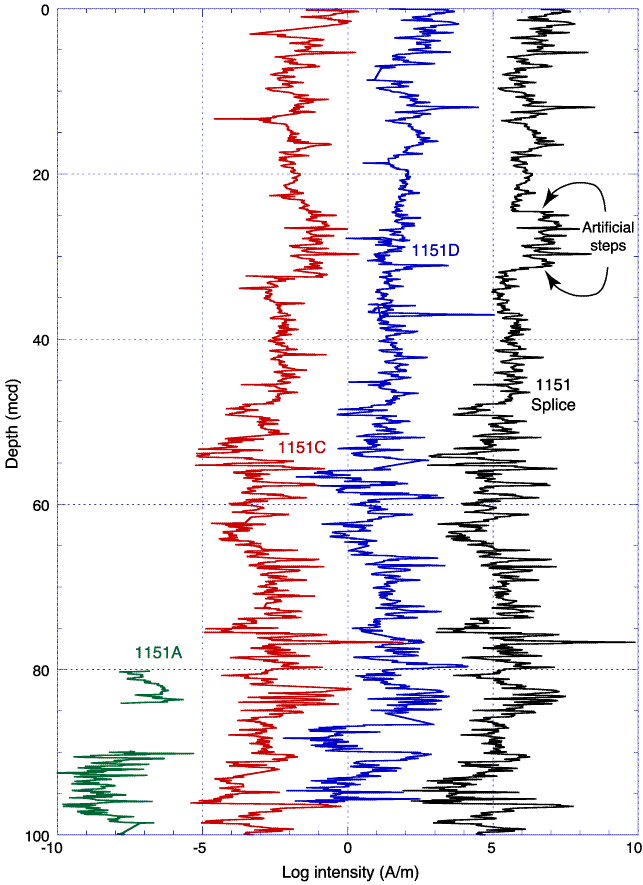
Figure F5. The natural log of the magnetic intensity (after 20-mT AF demagnetization) for Holes 1151A (bold green), 1151C (red), 1151D (blue), and the Site 1151 splice record (black) in the mcd scale. Integer values of +4, +8, and +12 were added to each data point from Holes 1151C and 1151D and for the spliced record, respectively, to separate data for the purposes of display. The artificial steps in the spliced intensity record occur because the spliced intervals were constructed using the magnetic susceptibility data.


![]()