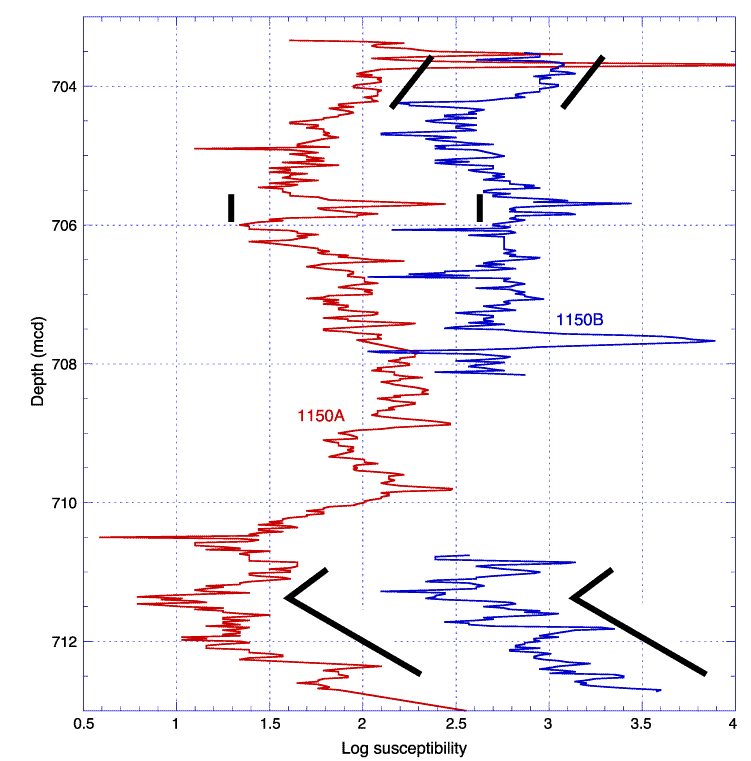
Figure F7. The natural log of the magnetic susceptibility (raw meter units) for Holes 1150A (red) and 1150B (blue). Integer values of +1 were added to each data point from Hole 1150B to separate data for purposes of display. Correlations were made only in the region of overlapping recovery, from 703.30 to 713.00 mbsf. Correlative features are denoted with thick black lines.


![]()