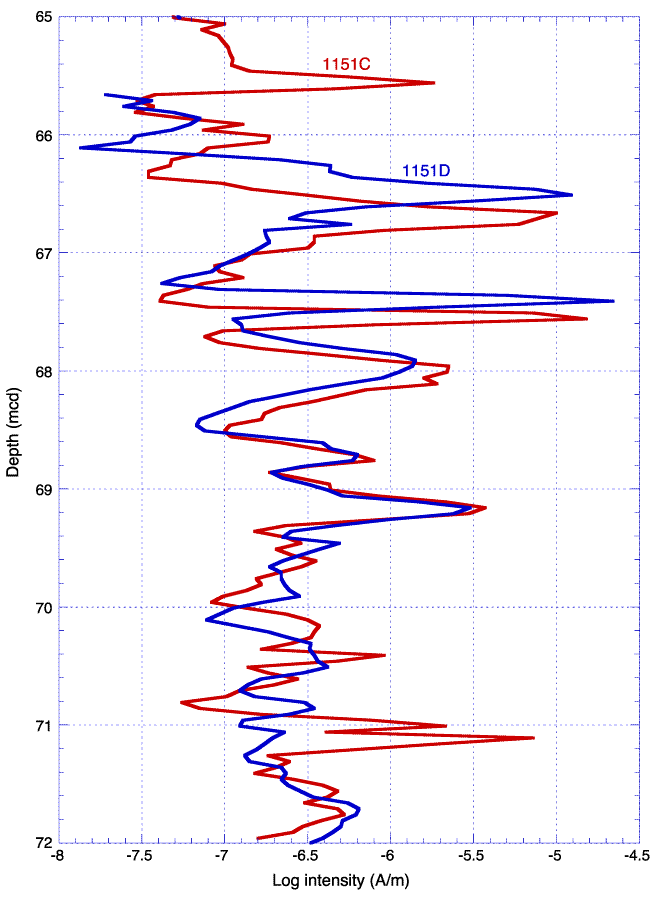
Figure F9. The natural log of the magnetic intensity (after 20-mT AF demagnetization) from Holes 1151C (red) and 1151D (blue) plotted to show depth correlation tie made along the double peak at ~69 mcd. Expansion or contraction of data in Hole 1151D relative to Hole 1151C is indicated by misalignment of correlative peaks above and below this tie point.


![]()