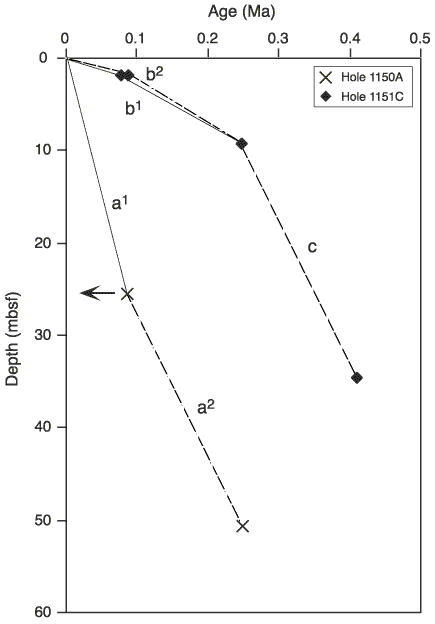
Figure F4. Age-depth plot of biostratigraphic events in Holes 1150A and 1151C. Solid line a1 = age-depth relationship in Cores 186-1150A-1H through 3H in Hole 1150A, where the age of Sample 186-1150A-3H, 0-4 cm (25.52 mbsf), is assumed to be 0.085 Ma. The age control point at 25.52 mbsf in Hole 1150A can be moved leftward along the horizontal axis because the true acme of E. huxleyi is expected to be found in a lower sample. Dotted line a2 = age-depth relationship between 25.52 and 50.72 mbsf based on the lowest studied sample (25.52 mbsf) and the FO of E. huxleyi observed by Shipboard Scientific Party (2000a). Kinked solid line b1 and kinked dotted line b2 = age-depth relationship between 9.42 and 0 mbsf in Hole 1151C, when the age of the 2.00-mbsf sample is posited as 0.073 and 0.085 Ma, respectively. The dotted line c = age-depth relationship between 34.68 and 9.42 mbsf in Hole 1151C based on the abrupt decrease of G. carribeanica (9.42 mbsf) and the LO of P. lacunosa (Shipboard Scientific Party, 2000b).


![]()