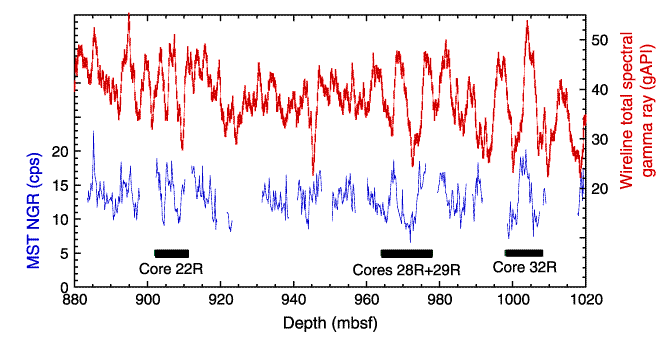
Figure F3. Correlation between total spectral gamma ray intensity measured by wireline logging in Hole 1150D and natural gamma ray (NGR) intensity of recovered cores in Hole 1150B. Intervals for Cores 186-1150B-22R, 28R + 29R, and 32R are shown as bars.


![]()