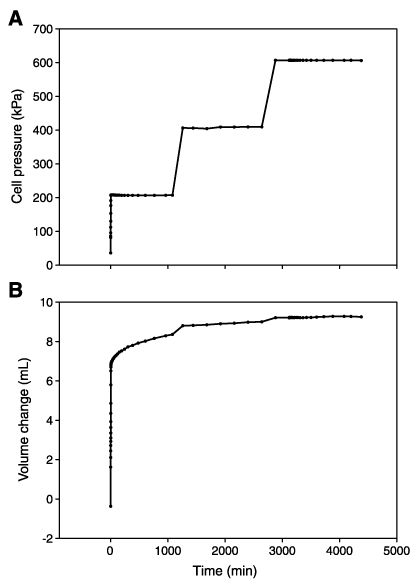
Figure F4. Saturation data (sample 1, Section 186-1151A-51R-1). A. Diagram shows the rise of cell pressure in three steps vs. time. B. Diagram as a result of parallel rise in cell pressure and pore pressure. The volume change device shows the flux of water into the sample.


![]()